Mammals (Part 1): New Zealand’s Isolation from Gondwana
Mammals (Part 1): New Zealand's Isolation from Gondwana
Mammals (Part 1): New Zealand's Isolation from Gondwana
Author: Malcolm Pullan, Guide
Date: October 2024
As a guide, one of the first things I tell international visitors to Tiritiri Matangi is that New Zealand has no native land mammals apart from bats. I suspect many other guides do the same. It certainly is quite an unusual fact and accounts for so much of why New Zealand bird life (and indeed all New Zealand life) is the way it is. I wonder how many guides go on to explain the absence of land mammals by some variation of the statement that New Zealand broke away from the rest of the world about 60 MYA (million years ago) before mammals evolved? I know I did when I first started guiding. It was one of those statements that I sort of grew up with and didn’t think to question. I wasn’t guiding for long though before I did begin to wonder how true that statement really was, and so I began to dig a little deeper. It turns out there are several things wrong with the crude statement: “New Zealand broke away from the rest of the world about 60 MYA before mammals evolved.” The truth—or at least the best current guess at the truth (because science is always evolving as new facts come to light)—is even more fascinating.
This article and the next two give a summary of the latest thinking on the story of mammals in New Zealand. This story goes under three headings:
- When did New Zealand really break away from rest of the world?
- When did mammals really evolve?
- Were there ever mammals in New Zealand before humans arrived (other than bats)?
This article begins the story by answering the first question. This is more of a question in geology and not really related to mammals explicitly. Nevertheless, it is necessary background information on which to overlay the answer to (2). I also think it’s rather an interesting question in its own right.
Before I begin with the first question, here are the short answers to all of them:
- About 80 MYA.
- About 205 to 210 MYA.
- Yes!
Intrigued? Read on…
When did New Zealand really break away from the rest of the world?
The first question here is, who wants to know? Most of the time the answer to when New Zealand broke away from the rest of the world is given by geologists, while much of the time the question is asked by people interested in plants and animals, i.e. people with an interest in biology. The end result is confusion, because the two groups of people are often talking about two different things. If you’re thinking about plants and animals, it’s rather fundamental to know whether they are on dry land or under water. Thus when biologists want to know when New Zealand broke away from the rest of the world, they want to know when there was some water between the two landmasses. Sounds obvious, doesn’t it?
Well, not to a geologist! You see, geologists tend to talk about rocks more often than water. When they talk about landmasses being separate, they often mean the underlying rocks of the two landmasses are separate rather than just being separated by sea. The difference here is that it is possible for underlying rocks of two dry landmasses to be joined even when there is no dry land joining them. When underlying rocks of two separate dry landmasses are joined, geologists often say the two landmasses themselves are joined, whereas biologists would say they aren’t. The North and South Islands are good examples here, as is Great Britain and the European continent. Both these pairs of landmasses share common underlying rocks, yet both have sea separating them.
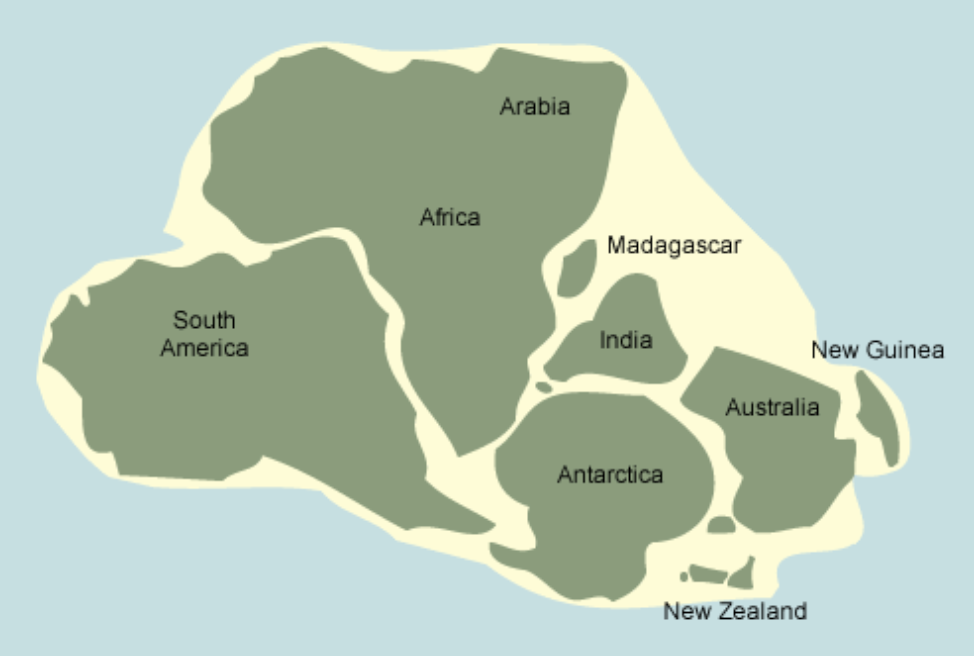
Are geologists just trying to be annoying and confuse everybody? Not at all. They are simply distinguishing between the two fundamental types of earth’s crust. The earth’s crust, i.e. the outer layer of the earth, is composed of two fundamentally different types of crust: oceanic crust and continental crust. Oceanic crust forms the bottom of the deep oceans and is generally at a depth of around 4km under the surface (but can be up to 11km in trenches). Continental crust forms the large landmasses of the earth including where these landmasses slope down to meet the oceanic crust at depth under the sea (see Figure 1). When geologists say two landmasses are separate, they tend to mean there is oceanic crust between them. One implication of this is that there is sea at a depth of around 4km or more between the two landmasses. This is quite different from saying there is no sea between the pieces of land at all! The reason geologists tend to talk about landmasses as pieces separated by oceanic crust, rather than pieces separated by sea, is that each piece of continental crust behaves as a unit, i.e. it changes and moves around as a segment of the earth’s crust independently of where the sea happens to be at any one time.
What’s all this got to do with when New Zealand broke away from the rest of the world? Well, that rough figure of 60 million years for when this occurred is actually more of a geologist’s answer. It’s roughly the time when the continental crust of New Zealand became properly separated from any other piece of continental crust and there was oceanic crust completely surrounding New Zealand. But there would have been an awful lot of sea between New Zealand and any other landmass then—an awful lot of sea that land animals wouldn’t have been able to cross for quite some time before this.
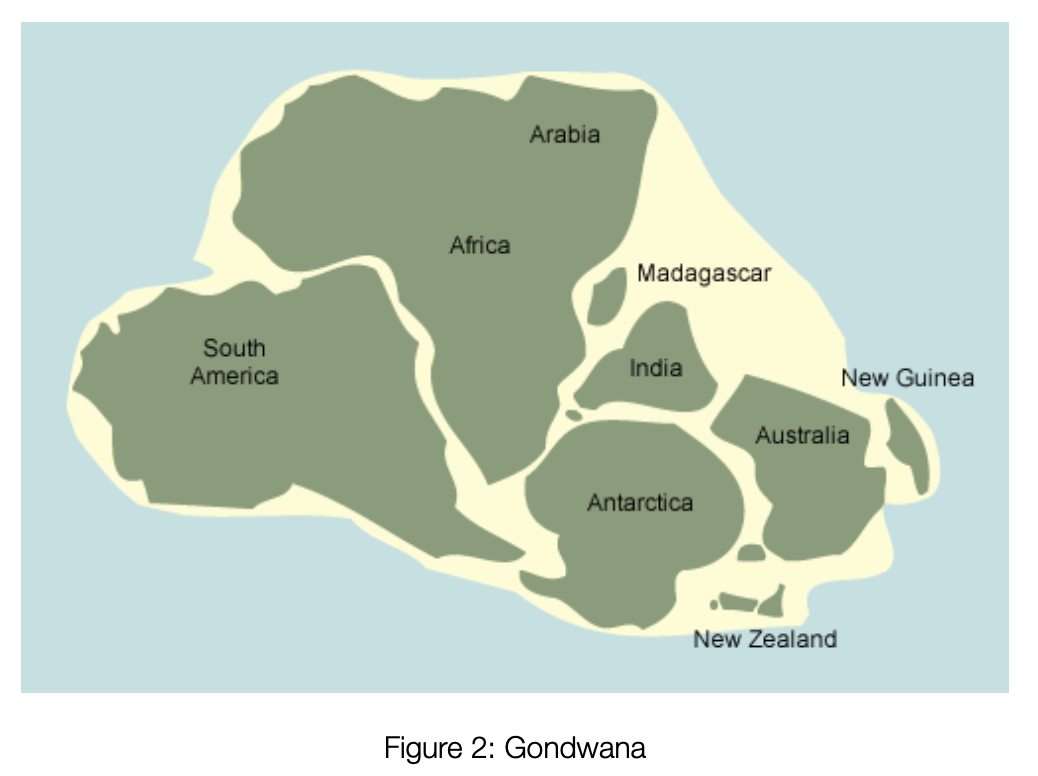
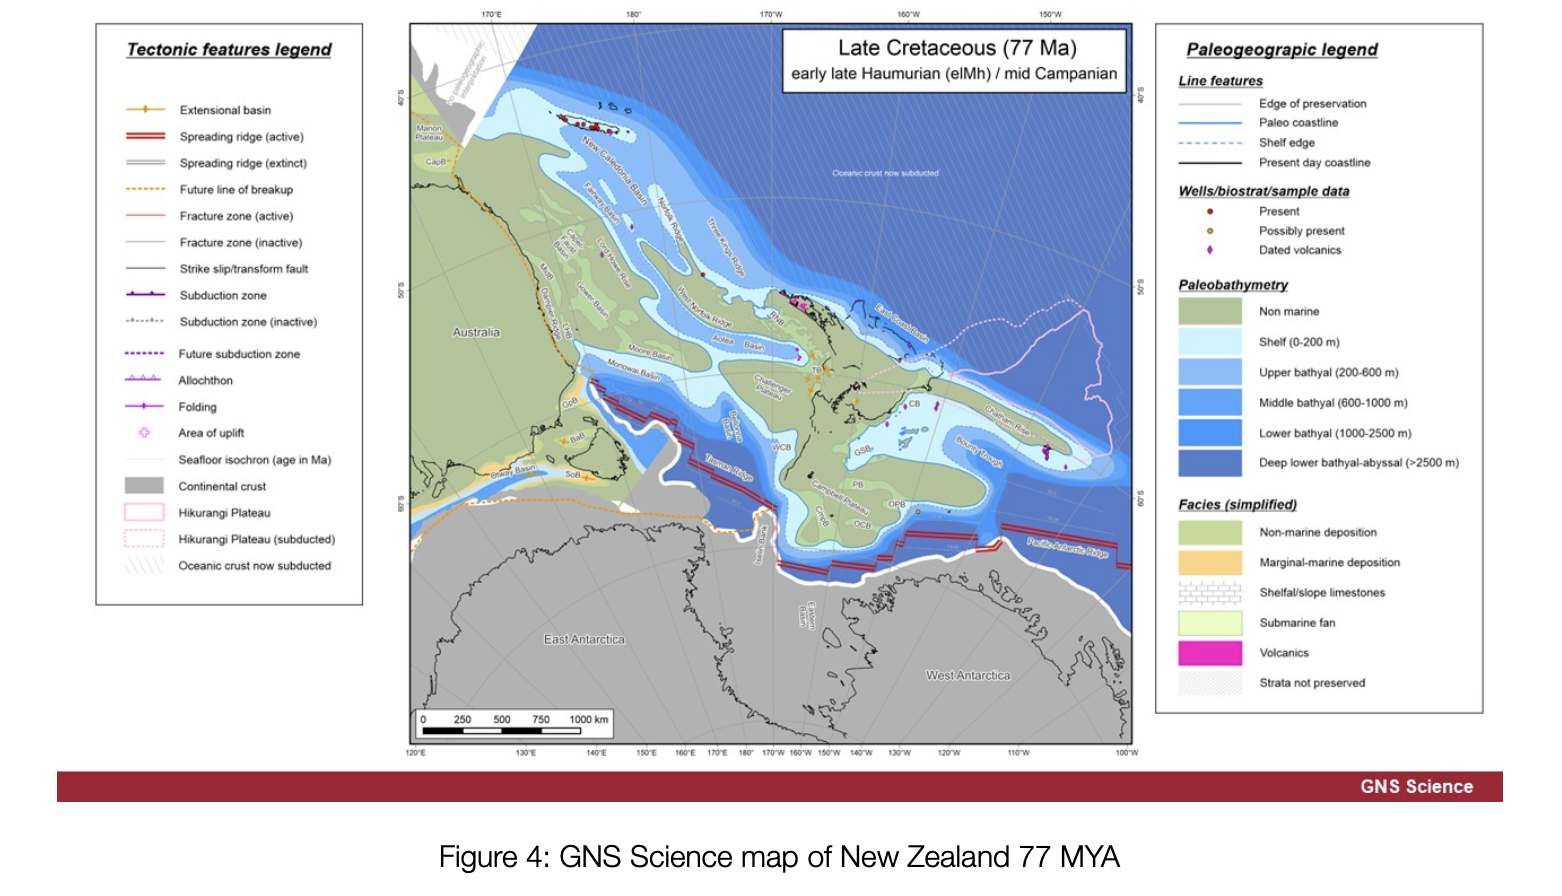
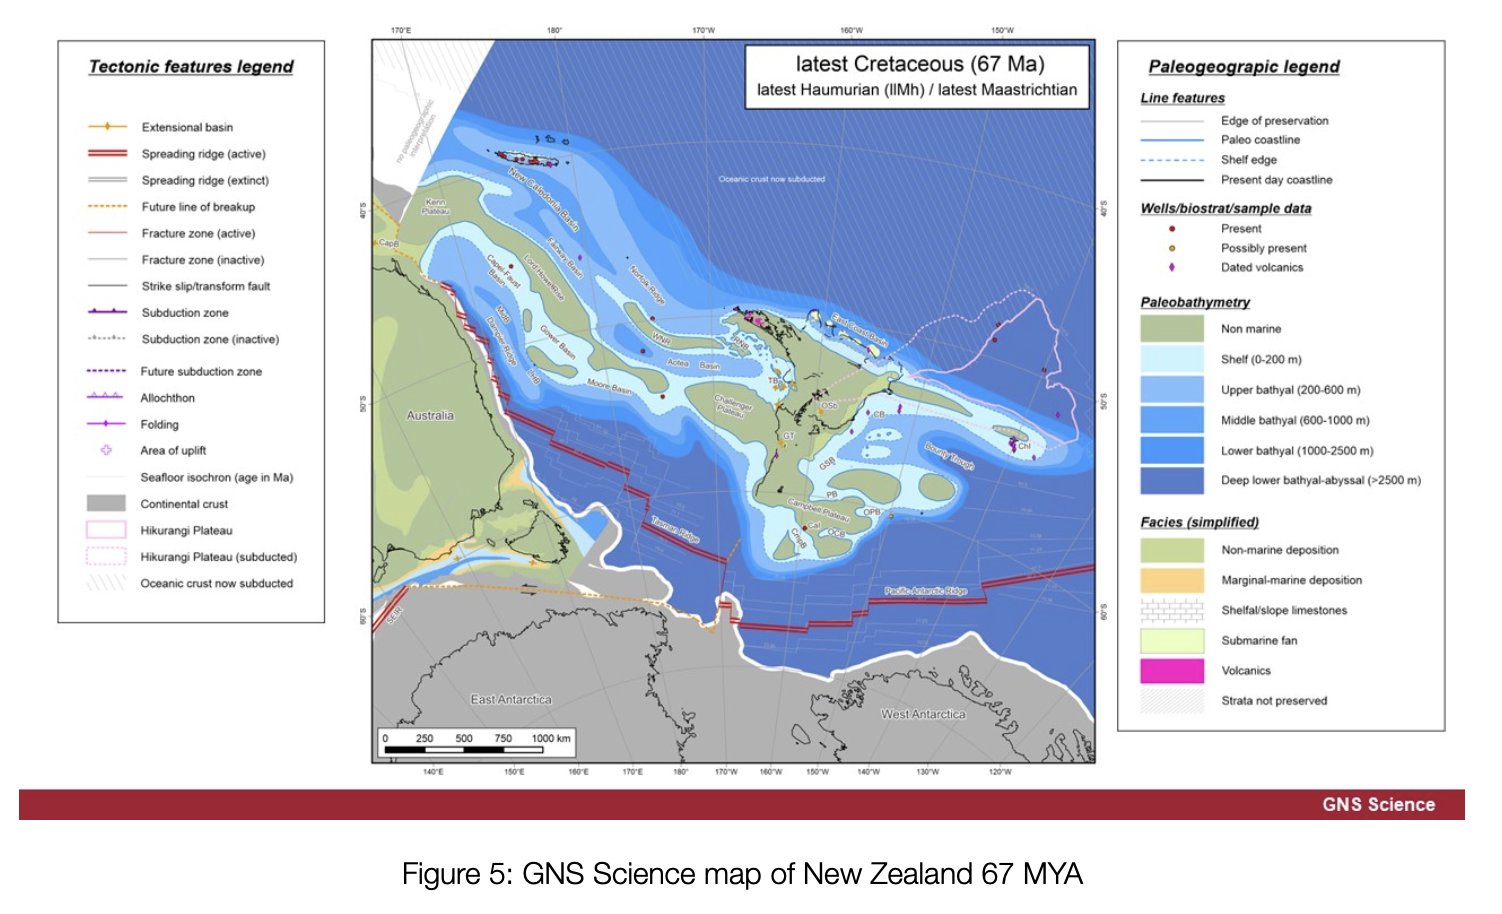
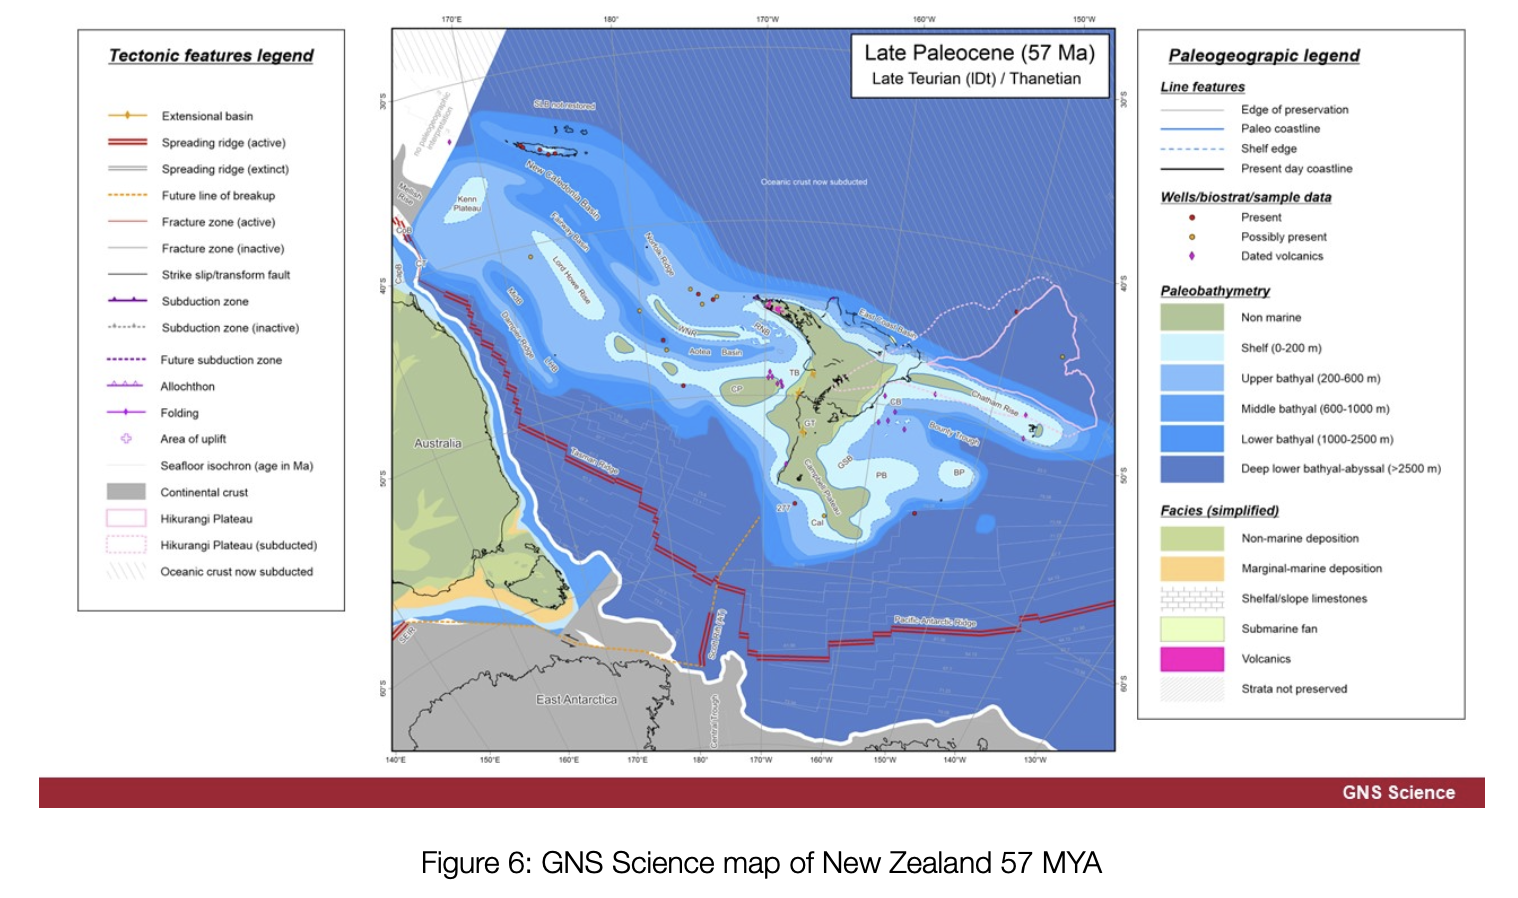
So what is the answer for biologists? When was there water between New Zealand and the rest of the world? The short answer is given above, i.e. about 80 MYA. To explain this, i.e. to reconcile the two answers, we need to return to geology for the story of the formation of New Zealand. The outline of this story has been known for a few decades now. In 2022, though, GNS Science released a series of fifteen maps showing New Zealand’s formation from 98 MYA ago to the present day (1). These maps give a much clearer picture than ever before of the story of New Zealand’s formation. A summary of this story is as follows (see Figures 3–6 for a selection of the GNS Science maps illustrating this story—and see the footnotes for examples of the processes described operating in today’s world if you’re interested): (2)
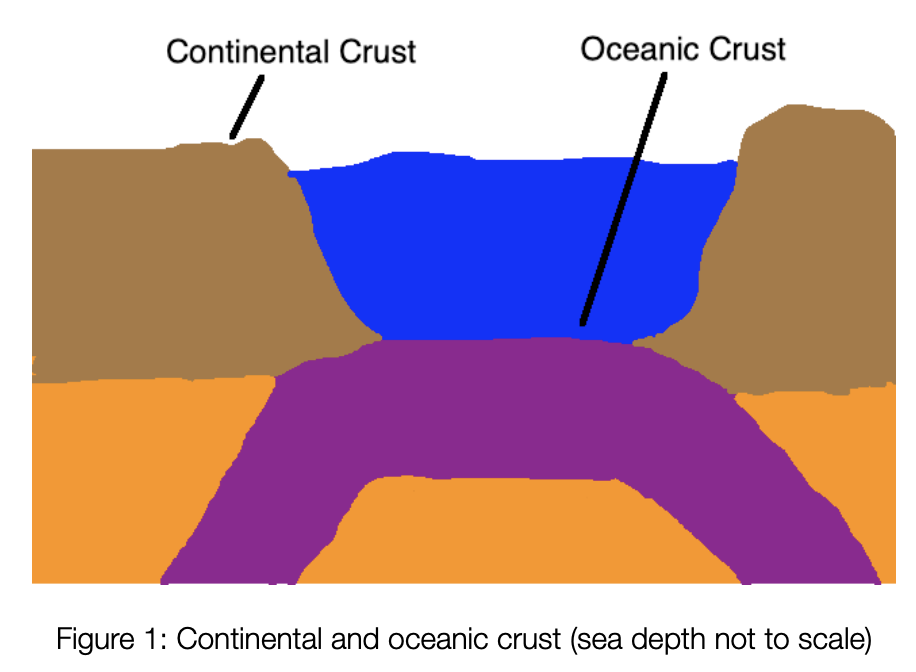
- About 180 MYA there was a supercontinent called Gondwana (see Figure 2). It comprised the land that is now India and the continents of the southern hemisphere (including Antarctica).
- By about 105 MYA Gondwana had broken up into various pieces, but New Zealand, Australia and Antarctica were still joined together.
- A rift began to form from this time separating New Zealand from the combined continent of Australia and Antarctica. As the rift formed, the land around it stretched and sank. (3)
- Sea began to appear in the rift soon after it formed. (4)
- The rift worked like a zip, unzipping New Zealand from Antarctica first and then working its way up towards and then along the coast of Australia.
- Oceanic crust began to appear in the rift about 85 MYA. (5)
- Sea completely surrounded New Zealand by about 80 MYA.
- The continental crust that New Zealand sits on (6) became completely isolated from the continental crust of Australia and Antarctica about 60 MYA. (7)
- Oceanic crust continued to form between the two pieces of continental crust until about 55 MYA. (8)
So when did New Zealand break away from the remnants of Gondwana? Well, to be precise, it’s a story spread over many millions of years. If one really needs to put a single date on it though, a geologist might want to say about 60 MYA, being the time New Zealand was surrounded by oceanic crust. Alternatively, a geologist might want to say about 85 MYA for when oceanic crust first appeared. If, however, one is interested in New Zealand life (which includes most Tiritiri Matangi people),
then the best figure is probably about 80 MYA for when New Zealand was completely surrounded by sea.
So there you have it—the first piece of the puzzle in the story of mammals in New Zealand. Part two of this series will give a brief summary of the evolution of mammals globally, with an emphasis on the story of mammals in Australia. Given that New Zealand is a chip off the Australian (and Antarctic) block, the Australian story forms the opening chapter of the story of mammals in New Zealand.
Footnotes:
(1) These maps can be downloaded and a video of the map sequence can be found here: https://www.gns.cri.nz/data-and-resources/the-100-million-year-history-of-te-riu-a-maui-zealandia-in-maps/.
(2) Several relatively recent sources give dates for the events described, such as Mortimer and Cambell’s Zealandia and Gibbs’ Ghosts of Gondwana. Most of the dates given above come from the former source. Where possible, I have estimated other dates from the more recent pictures by GNS Science, e.g. the date of 80 MYA for New Zealand being completely surrounded by sea.
(3) A contemporary example of a rift forming in a continent is the Great Rift Valley of east Africa that runs through countries such as Kenya, Tanzania, Uganda and Ethiopia. If this rift continues, east Africa will eventually separate from the rest of Africa like New Zealand has from Australia and Antarctica.
(4) The Red Sea is a more contemporary example of sea flooding into a continental rift. In fact, the Red Sea is part of the rift forming the Great Rift Valley in Africa (see previous footnote).
(5) Oceanic crust has appeared in the Red Sea (see previous footnote).
(6) This piece of continental crust is called Zealandia. In addition to New Zealand, it includes other pieces of dry land, such as the distant Chatham Islands, the sub-Antarctic islands, and even Norfolk Island and New Caledonia.
(7) Madagascar is similar to New Zealand in that it split from remnants of Gondwana and is now completely surrounded by oceanic crust.
(8) Oceanic crust continues to be formed today in rifts formed a very long time ago. One of the most well-known examples is the Mid-Atlantic Ridge that runs all the way down the middle of the Atlantic Ocean. The oceanic crust being formed there widens the Atlantic Ocean by about 2–5cm per year.
References:
Gibbs, G. 2016. Ghost of Gondwana: The History of Life in New Zealand (revised edition). Potter & Burton, Nelson. (Chapter 4)
Lomolino, M.V., Riddle, B.R. & Whittaker, R.J. 2018. Biogeography: Biological Diversity across Space and Time (5th ed.). Sinauer Associates, Sunderland, MA. (pp. 250–254, 258)
Mortimer, N., Campbell, H. 2014. Zealandia: Our Continent Revealed. Penguin Books, Auckland. (pp. 202–204)
Pough, F.H, Bemis, W.E, McGuire, B. & Janis, C.M. 2023. Vertebrate Life (11th ed.). Sinauer Associates, New York. (p. 492)
Wicander, R. & Monroe, J.S. 2016. Historical Geology: Evolution of Earth & Life Through Time 8th ed.). Engage Learning, Boston. (p. 50)
Picture credits:
- Figure 1: My own work (can you tell?!)
- Figure 2: Zealandia website: https://www.visitzealandia.com/About/History/The-Continent-of-Zealandia (slightly modified).
- Figures 3–6: https://www.gns.cri.nz/assets/15-Maps-of-Zealandias-History.zip. The original source of the maps is:
Strogen, D. P., Seebeck, H., Hines, B. R., Bland, K. J., & Crampton, J. S. 2022. Palaeogeographic evolution of Zealandia: mid-Cretaceous to present. New Zealand Journal of Geology and Geophysics, 66(3), pp. 528–557. (https://doi.org/10.1080/00288306.2022.2115520)

Argentine Ants on Tiritiri Matangi
Argentine Ant
Argentine Ant
Author: Chris Green, Department of Conservation
Date: From the Supporters of Tiritiri Matangi Archives, Dawn ChorusHeader photo: Chris Green
Supporters of Tiritiri Matangi Archives, Dawn Chorus, Autumn 2000
Ten years ago a new immigrant species slipped quietly into New Zealand, arriving in Auckland and establishing itself in Onehunga, just prior to the Commonwealth Games in 1990. That immigrant was the Argentine ant (linepithema humile) and initial surveys quickly revealed it to be quiet widespread. It was decided that there would be no welcoming committee dishing out pesticide sprays, or free food laced with insecticide, as has been the scenario when insect pests such as fruit fly or tussock moth arrived. Those entomologists “in the know” however, knew that New Zealand had come of age with this arrival of one of the world’s most invasive pest ant species.
The Argentine ant is a native of South America and has been invading overseas countries, including North America, Hawaii, South Africa, and Australia, for more than 50 years. Since its arrival in New Zealand, Argentine ant has spread to many areas in the Auckland Region, established itself in Tauranga and Morrinsville, and has recently been reported from Christchurch, Gisbourne and west of Dargaville. Now it has been found on Tiritiri.
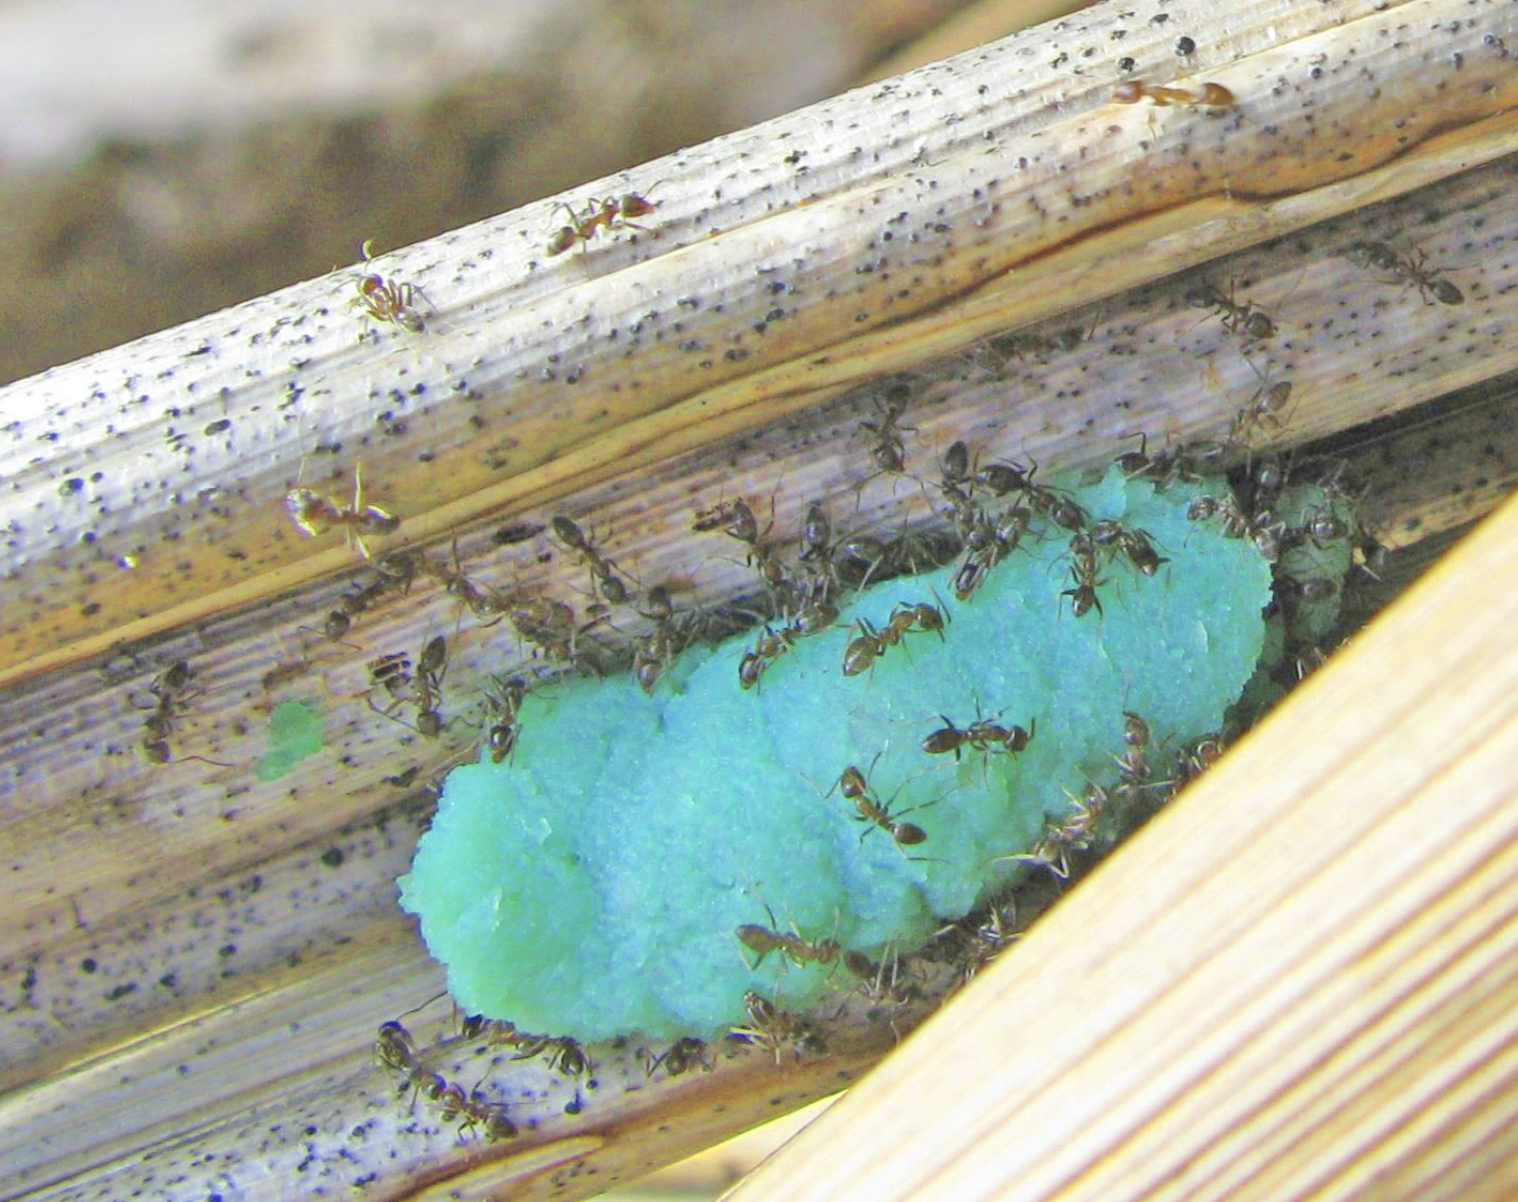
Argentine ants are small-two to three millimetres long-are a pale red-brown and cannot spread by flying, only by walking or being carried. The ant is particularly successful because it develops large multi-nest colonies with huge numbers of workers that swamp food sources. Like most other ants they feed on sweet, surgery solutions such as nectar, as well as protein-based foods such as insects. Overseas research has shown that after these ants invade a site most other ant species disappear, any many other insect groups suffer a significant decline.
Argentine ant has several attributes that make it much more successful than other ants. A key feature that sets the species apart from most other ant species is that workers from neighbouring Argentine ant colonies cooperate with each other. Thus when a new food source is located, such as a tree coming into flower, all surrounding nests will be able to partake. Because it is very active, fast-moving ant, the species often locate new food sources ahead of other species and can thus more efficiently dominate all available sources in the area occupied. The species also features a highly developed chemical defence secretion, which will force the retreat of most other ants and invertebrates, even when these other species are much larger than Argentine ants. Thus despite their small size, Argentine ants often frequently win one-on-one contests.
Unlike virtually any other ants in New Zealand, Argentine ant trails feature huge number of ants, moving in a stream of up to five to six ants wide, like a busy six-lane motorway. These huge trails can be seen frequently moving up trunks of flowering trees, where the ants feed on nectar from flowers. They are also well known to exploit or “farm” honeydrew from other insects such as the mealybugs, which are common on flax Tiritiri. The sheet numerical superiority of the species tends to lock up these food resources and prevent other fauna feeding on them. This has implications for many species of invertebrates, lizards and birds that would normally feed on nectar and honeydew. As well as being extremely successful competitors the ants are predators of many invertebrate groups and there are even reports of them killing recently hatched chickens and invading broken eggs.
With an international reputation like this, it is a species that the Department of Conservation would prefer not to see in our nature reserves, especially our offshore islands used as safe havens for endangered species. Therefore, several years ago I put up a bid to have research undertaken in Auckland to determine if Argentine ant is likely to have such a severe impact on our native ecosystem as has been reported overseas. As a result two studies were instigated in Auckland last year, one by Landcare Research Ltd, and another by a PhD student. Results of this research will be some years away, but in the interim the decision has been made by the Auckland Conservator that the any should be eradicated from Tiritiri.
The Landcare contact includes research on a new insecticide ant bait, and early trials elsewhere in Auckland indicate it is very effective against the ant. Landcare has agreed to take part in an eradication campaign using the bait.
Surveys carried our over April indicate that the ant is present over about 5% of the island, centred on the wharf area. It is fortuitous that it has not reached the nursery or buildings at the top of the island, and special precautions are being taken to reduce the risk of the ant being carried up there. Other areas of the island are still being checked in detail.
It is extremely important that the ants are left undisturbed so they do not spread out even further before poisoning over the winter period. If visitors to the island see any ants please do not touch them. When disturbed, the multi-queened nests are likely to fragment, and potentially each queen can set up a new separate nest, thus spreading the problem over a greater area.
It appears as though Argentine ant has been on Tiritiri for some time, possibly several years. The best guess is that is that is probably came in on heavy machinery as a complete nest. The Department if moving quickly to eradicate the species as soon as possible.
Supporters of Tiritiri Matangi Archives, Dawn Chorus, February 2005
Argentine ants were first discovered on Tiritiri in March 2000. The species is recognised as one of the 100 most important pests of the world due to the impact it has on other wildlife, particularly invertebrates, but also lizards, frogs and birds. The ant has many attributes which make it such a successful pest (see Bulletin f or details) but three key features stand out. Each nest can have huge numbers, up to hundreds of thousands, foragers are active 24 hours a day, unlike most ants which are either diurnal or nocturnal (not both), and all Argentine ant nests co-operate with each other. These, and other features, mean the species can dominate whole ecosystems where conditions are suitable.
During the summer of 2001 a group of 14 ant specialists and volunteers f rom around New Zealand assembled on Tiritiri to administer the first treatment of poison baits over the whole 11 hectare area mostly centred around the wharf but also including a small population at Northeast Bay. Insecticide paste baits were placed every 2 – 3 metres in a grid fashion, as described in Bulletin 45. Intensive post-bait monitoring revealed that a massive 99% of the ants were killed. No longer were swarms of ants seen on trees and concrete edges by visitors waiting f or the afternoon ferry.
Following on from that first treatment a second treatment was applied in December 2001, again covering the entire previously infested area. As in the first season, there was a good kill but, frustratingly, once again a small number survived. However, there was no sign of any at Northeast Bay. In fact there hasn’t been an Argentine ants seen there since autumn 2001. Yeah!!!
During the 2002-03 season, with the assistance of Landcare Research, there was a lot of research into monitoring methods to detect small nests of surviving ants. Sticky traps, pitfall traps and various non-toxic baits were trialled. In the end we chose non-toxic baits placed in tubes with netting covers to prevent interference from other wildlife. Monitoring from December 2002 through to February 2003 showed surviving colonies of Argentine ants at just eight sites (see red areas on photo). All of these were initially small colonies but two, around the wharf shelter and above the wharf pond, grew rapidly in size during summer with the ants covering about 300 square metres at each site by early March. All eight sites, plus buffer areas (blue areas on photo), were treated with insecticide baits during March – April. Compared to the large scale treatment of the whole 11 hectare area (inside the black line on photo) the spot treatment of these sites was straightforward. However, particular attention was paid to getting optimum weather conditions and ensuring there were no gaps in bait coverage. Each site was baited twice, a month apart. Intensive monitoring during January – March 2004 showed no surviving Argentine ants at any of the sites spot treated during 2003 so the attention to detail really paid off. Other sites were monitored and only two small nests were found. Both were spot treated twice, as per the previous season. Therefore, after four years of the eradication programme I feel we are very close to eradication but now the real grind starts. In any eradication programme the last individual is always the hardest and most expensive to kill. Making sure there are no survivors is the tricky part – that is the current challenge. Two years Argentine ant-free status is required before the programme can be declared successful. Argentine ant was first found in New Zealand in 1990 and is now widespread in many parts of Auckland, as well as some towns to the north and south. Thus we all need to be forever vigilant to ensure no new nests of Argentine ants are transported to Tiritiri. As with rodents and other pests, prevention is better than cure.
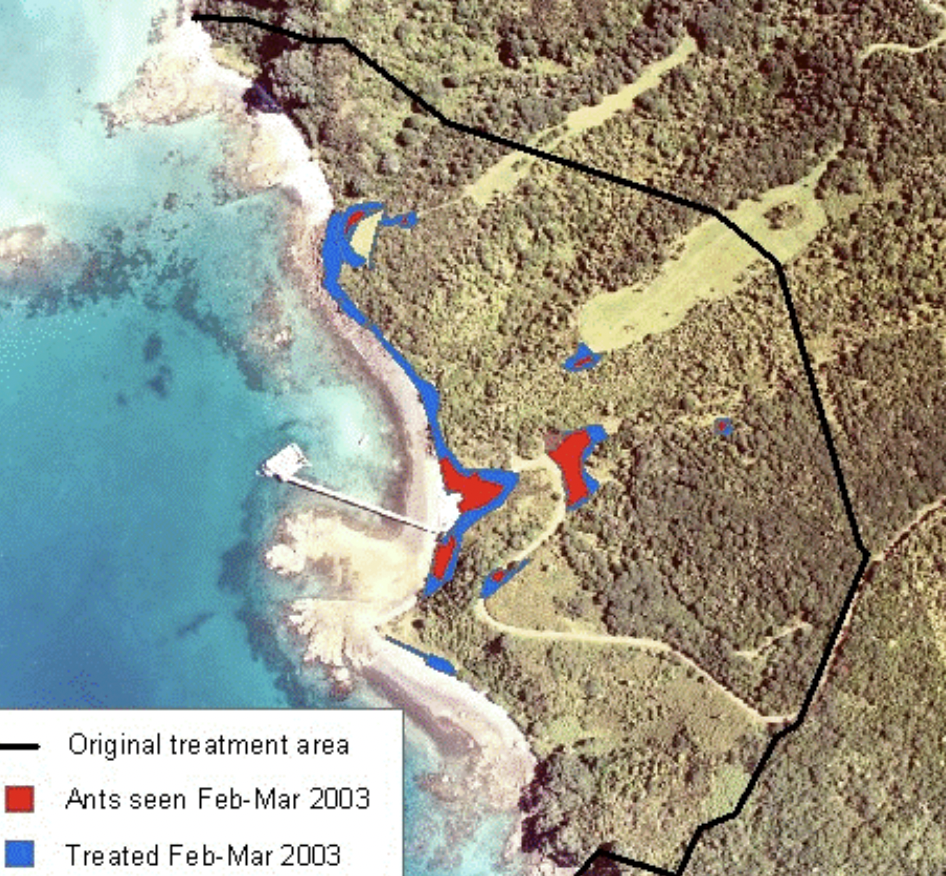
Aerial photo of main Argentine ant infestation showing entire area treated in years one and two (within the black line), ant sites for year three (red areas) and buffer areas (blue) treated in year three.

MinterEllisonRuddWatts (MERW), our primary corporate partners
MinterEllisonRuddWatts (MERW), our primary corporate partners
MinterEllisonRuddWatts (MERW), our primary corporate partners
Author: Debbie Marshall, Operations Manager
Date: September 2024Header photo: Jonathan Mower
MinterEllisonRuddWatts (MERW), are our primary corporate partners. Their stated purpose is “Working with you to help shape New Zealand’s future”. They are very involved with Supporters of Tiritiri Matangi (SoTM) under the auspices of their Community Investment Programme.
At the recent SoTM AGM, Stephanie de Groot, Partner; environment, planning and resource management, told members that “.. the pillars of our sustainability strategy are Environment, People and Practices. These focus on responsible consumption and production of goods and services, striving towards nett zero by 2050, being an inclusive and equitable place to work, doing what matters for their people and communities, and partnering with clients and others to tackle sustainability issues”.
Their legal team have looked at our procedures in terms of the Health & Safety Act 2015, the proposed accommodation facility and the concessions SoTM has with the Department of Conservation. They also offer support in areas of Human Resources, Finance, Marketing, Business Development and IT.
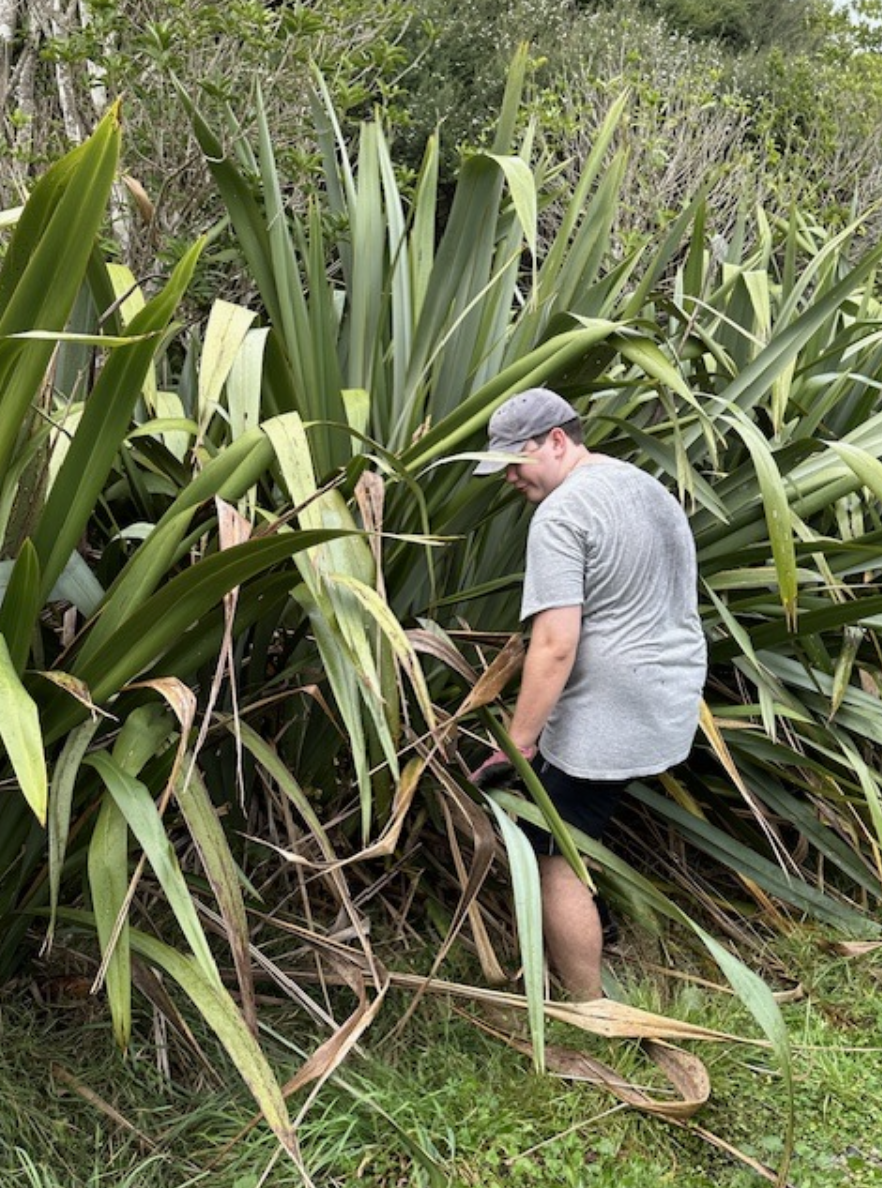
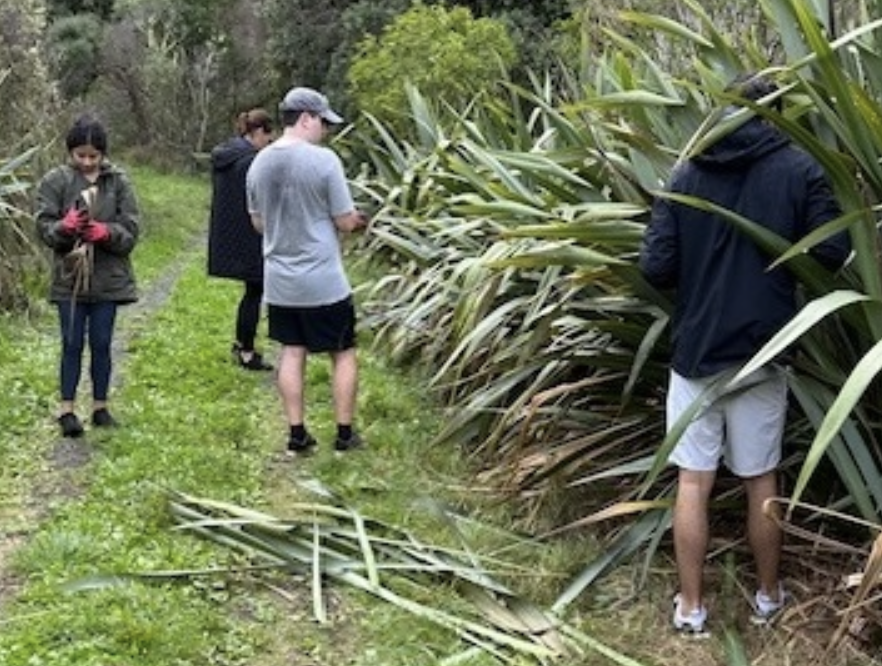
Since they joined up in June of 2023 most of their partners and staff have come to the motu, in groups of 10-12, working with our guides doing track trimming and cleaning up beaches and ditches or anything else that needs doing, working hard and happily regardless of the weather.
A recent visit took them to the northeast end of the island where the local takahe family were very taken with the goings on. They marched up and down checking out the piles being thrown into the bushes and staying nearby for the entire time the clean-up was happening.
The team’s appreciation of the clean, clear air and stunning environment was a reminder to the guides of how privileged we are to be able to showcase the island with a corporate sponsor who shares our values.
Flower feast week on Tiritiri Matangi as the island begins its spring flower display
Flower feast week on Tiritiri Matangi as the island begins its spring flower display
Flower feast week on Tiritiri Matangi as the island begins its spring flower display
Author: Jean Goldschmidt, guide
Date: 15th August 2024
Header image credit: Kay Milton
Flower feast week on Tiritiri Matangi as the island begins its spring flower display. Carpets of yellow cover the tracks under kowhai trees as the tūī rummage and attack each flower sending discarded petals to the ground. Too soon these delicious golden bell-like flowers will be gone leaving the ravaged trees to begin their cycle of regrowth once more.
The children in my group today do not hunt for the spectacular but are seeking the more modest flowers of Aotearoa, which they find hiding in the foliage. Our insect-pollinated flowers may be tiny but they are significant as the birds feed on their pollen and litter the ground with the carcasses.
As the only group walking up the road these exuberant, energetic ten-year-olds make the most of the freedom to leap ahead when they glimpse a bird, call out a name, listen for the call of the tieke or rush to the record sheet to check off their sighting. Standing still is impossible so any offering from me is brief. After the first experience with the magnifying glasses, they desire nothing else. Their fascination knows no bounds as they hold the glass to every leaf, feather, stalk, or stone.
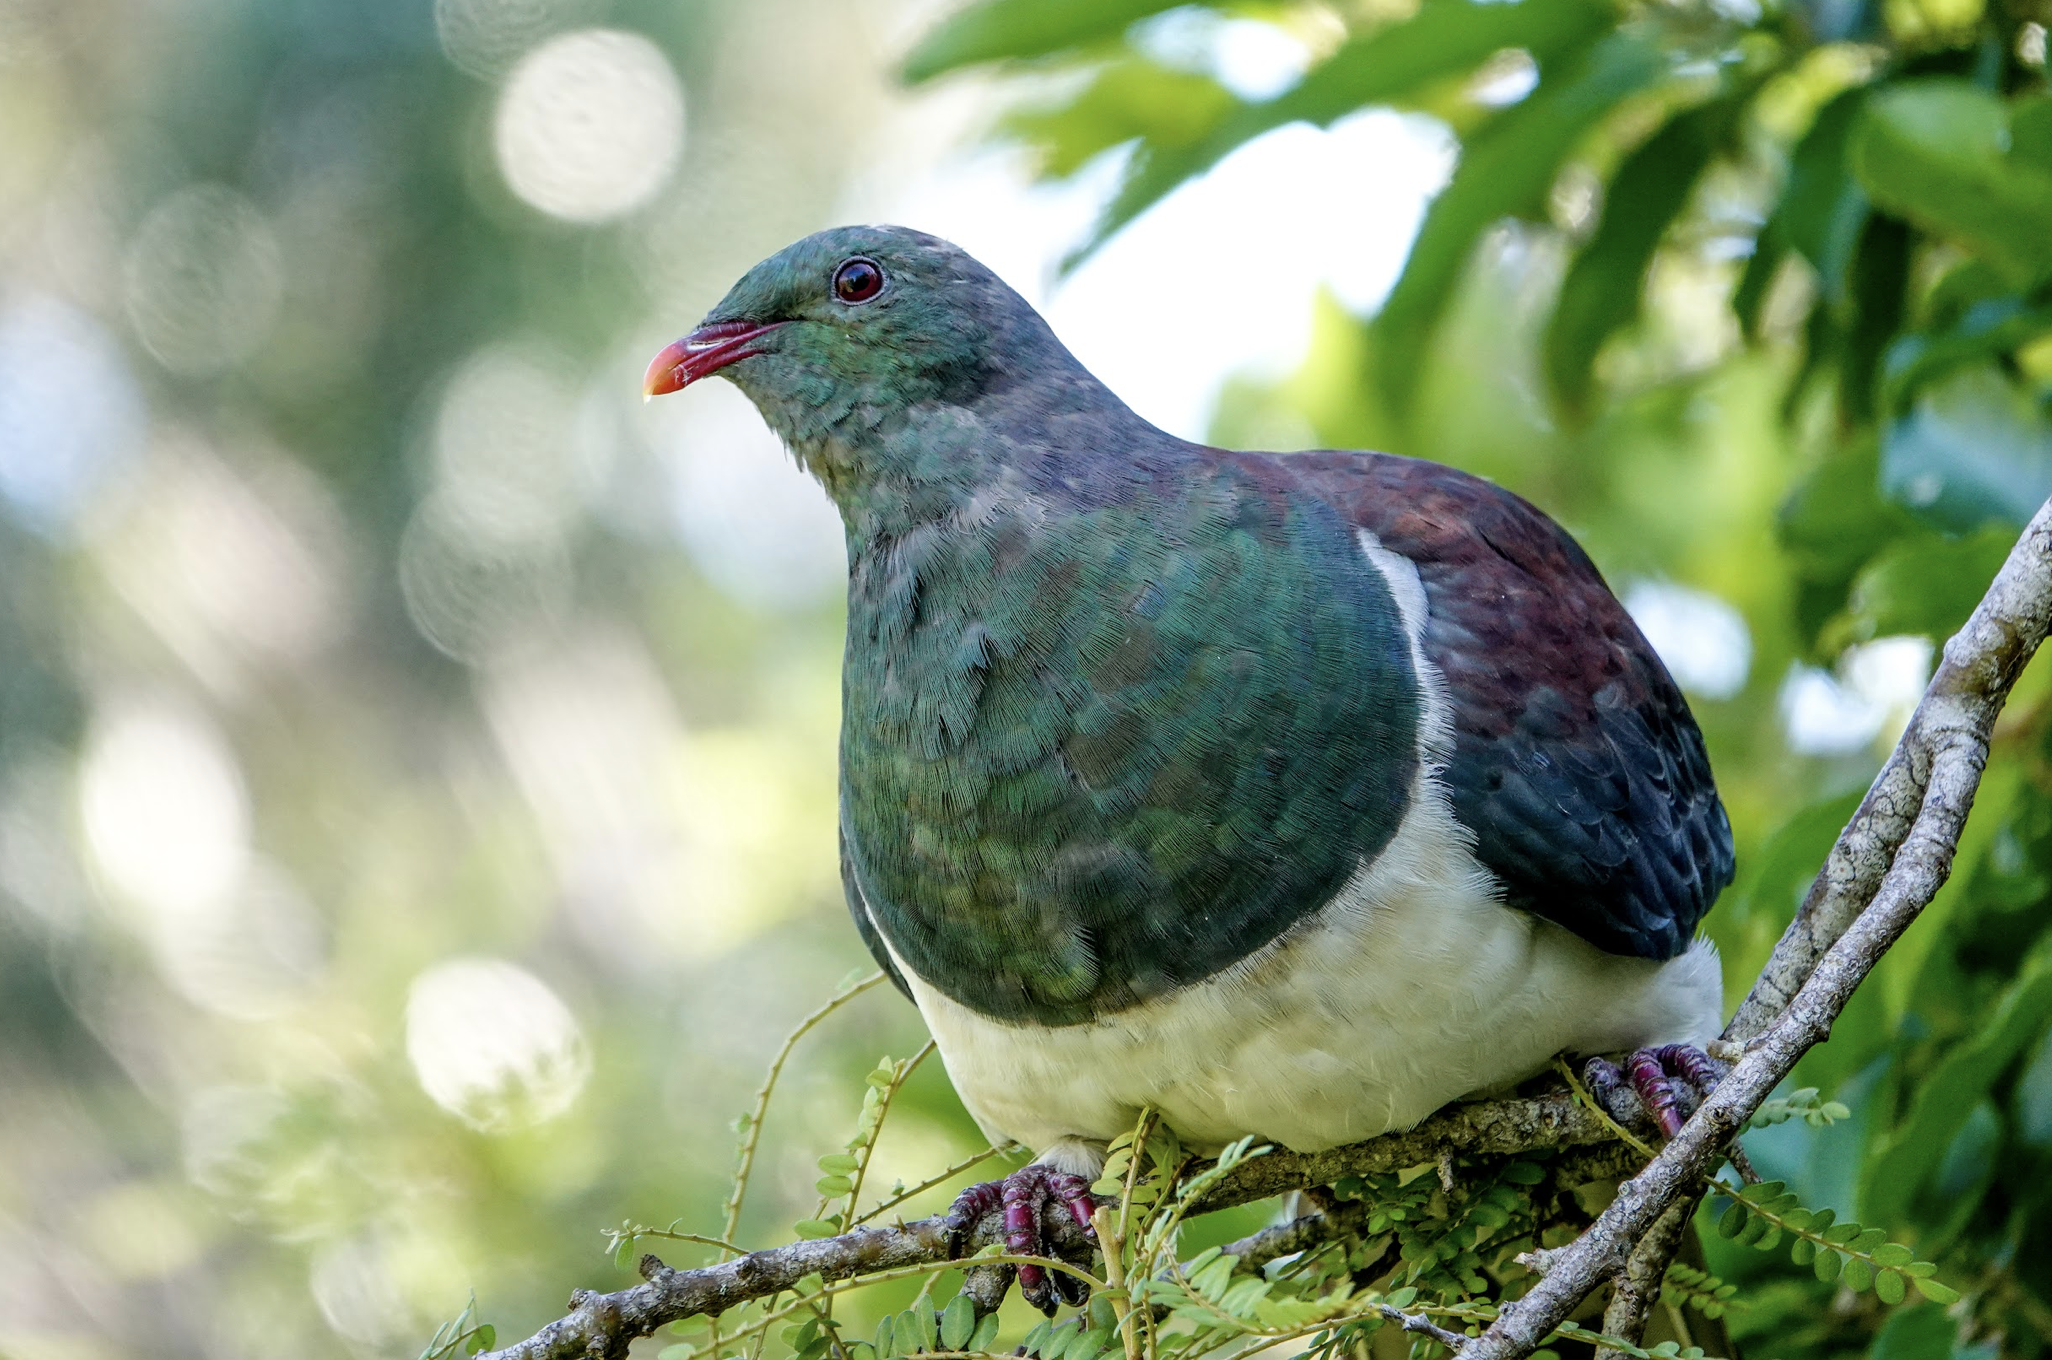
Under a pūriri, flush with ruffled new dark green leaves they find the tree’s delicate mauve flowers. Through the glass the long stamens full of pollen hang out almost beyond the petals and look so beautiful I wish I were a bird and able to nuzzle in with my nose. But they find more in the tree. Looking up they point to tiny seeds in colours of white, pink, and finally the luscious red of the ripe berry. It is no wonder this is the Tiritiri Matangi supermarket tree.
Cream flowers drip from the māhoe and karamū but nothing can be more beautiful than the white flowers of the mānuka or the red of the karo peeping out from their delicate enclosures. Seen through the magnifying glasses these miniature flowers come to life, in a way that help us understand why the birds so love these flowers.
The children are on the hunt for the birds their teacher had taught them about and for which they know the Māori names – the hihi, a bird they have never seen and the kererū known to only a few. They quickly recognise the korimako, marking each sighting on the tally sheet until it overflows. Excitement mounts when a male hihi perches on a branch at eye level and remains in place long enough to be admired. Something was up with the pōpokatea. I have never heard such a racket. Are they defending territory or has a rival stolen their favourite female? Whatever it is there is anger from both sides of the track. In their large groups they usually fly across the path with their gentle swishing call. We leave the chaos hoping they can sort it out themselves.
Out came the glasses again and this time we look at the fine threads of the skeleton leaves, spiders and insects in the cabbage tree trunks and the multi-coloured lichens. After a brief explanation of the pūriri moth, the popular Māori father we have with us tells of how his grandfather extracted the pūriri grubs from holes in the tree and ate them, just like I did as a child eating huhu grubs found tucked in rotten wood. He remembers a peanut butter taste. He also told of his parents rubbing the kawakawa leaves into a pulp and having it applied to any cut, scratch or pain he had.
As we walk along one little girl asks how old I am. When I don’t respond she says, “I won’t tell anyone.” Then later still “Are you 100?”. “Nearly “, I say. She tried again at 92. They love the puppets and the best spotter spent his time at the back of the line. Then, thinking I could rid them of excess energy I race them up the track arriving at exactly 12.30, our deadline. At lunch, guides share their stories of the fun they have had with their groups as there is always something to enjoy and for me, there is always some new learning.
The tīeke/saddleback scheme and what it can teach us
Celebrating 40 years of tīeke/saddleback on Tiritiri Matangi
Celebrating 40 years of tīeke/saddleback on Tiritiri Matangi
Author: Kay Milton and John Stewart, Biodiversity Sub-Committee
Date: May 2024, Dawn Chorus 137
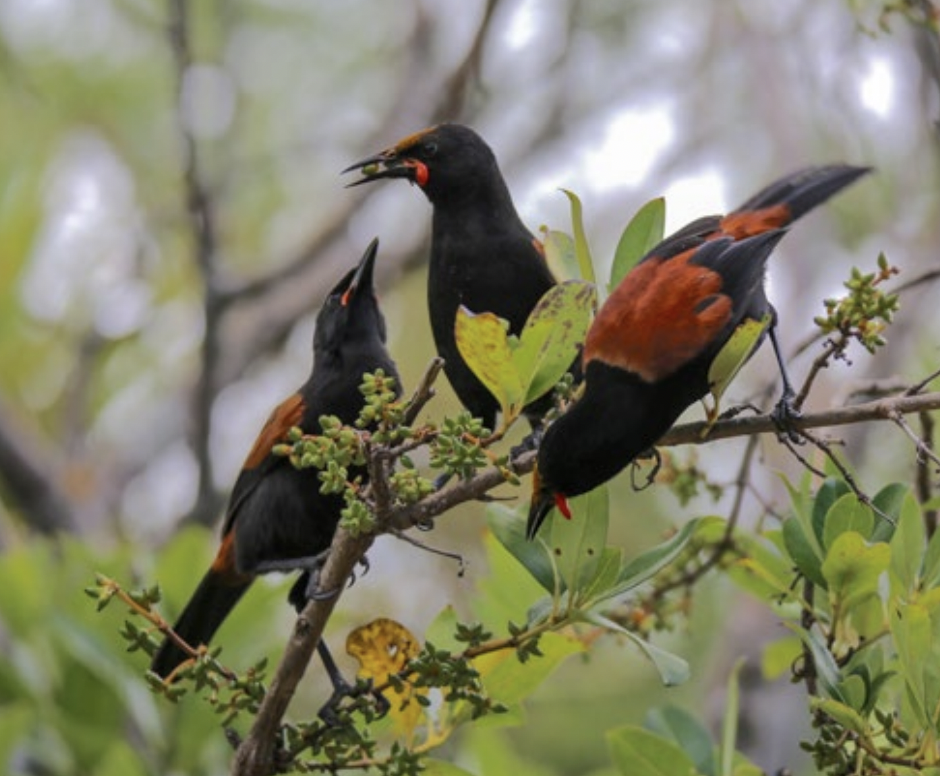
Header image credit: John Sibley
When tīeke/saddleback arrived on Tiritiri Matangi in 1984, it was truly the beginning of an era. Not only did they bring new sights and sounds to enrich the experience of anyone visiting the Island, they also marked the beginning of a project that would consume many working hours over the subsequent 40 years and which continues to this day. In 1984, only a small fraction of the original bush cover remained, and the planting programme was only just getting underway. This meant there were very few sites where tīeke could nest, so boxes were provided for this purpose. There were 360 boxes, but regularly monitoring this number proved difficult, and, as the bush planted between 1984 and 1994 has matured, an increasing number of ‘natural’ sites has become available. Between 2008 and 2012, the number of boxes was reduced to a level that could be more easily managed by a team of volunteers. Since then, it has been relatively stable at around 150-160 boxes.
Barbara was tasked with the responsibility of checking the boxes once a week during the season, and twice a week when eggs were hatching. This was quite a laborious task, which required a great deal of dedication, attention to detail, and physical exertion. Ray prepared dinner for them on the days when Barbara was occupied with checking the boxes. Barbara and Ray also used to band the tīeke chicks in the nest boxes.
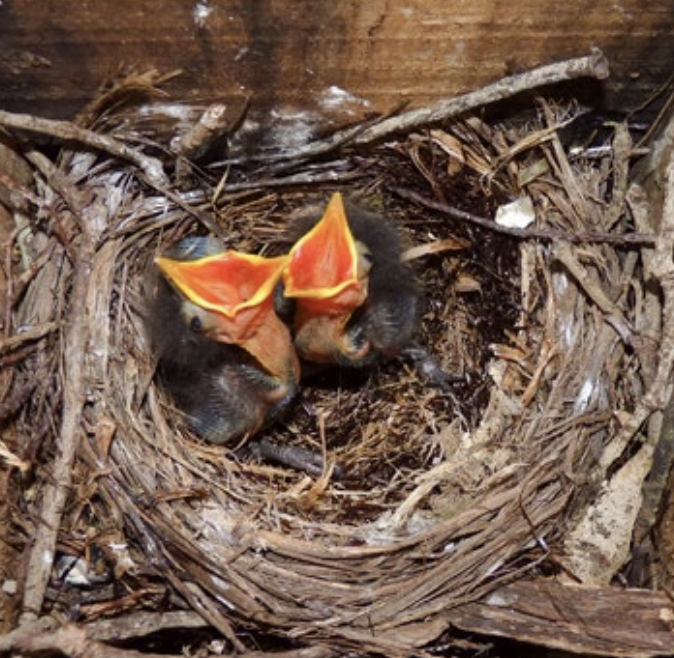
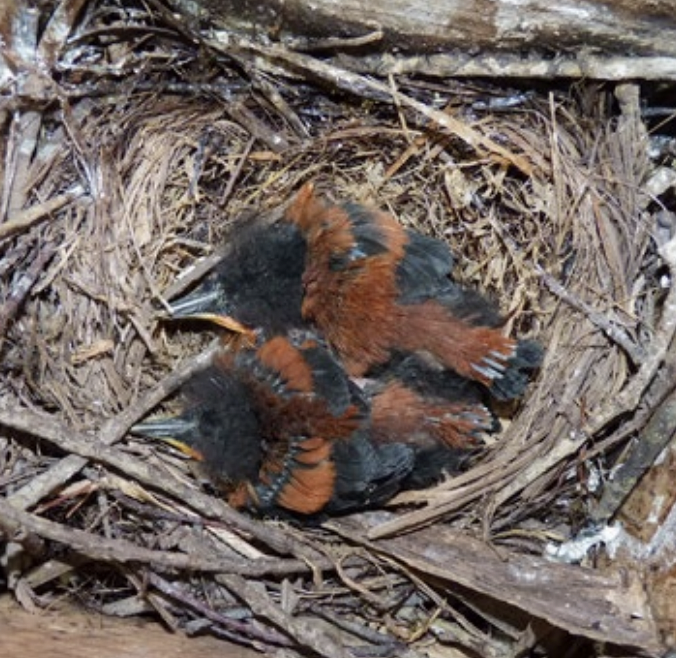
Left image: Pulli 6 days old. Right image: Pulli 13 days old
Left image: Pulli 6 days old. Right image: Pulli 13 days old
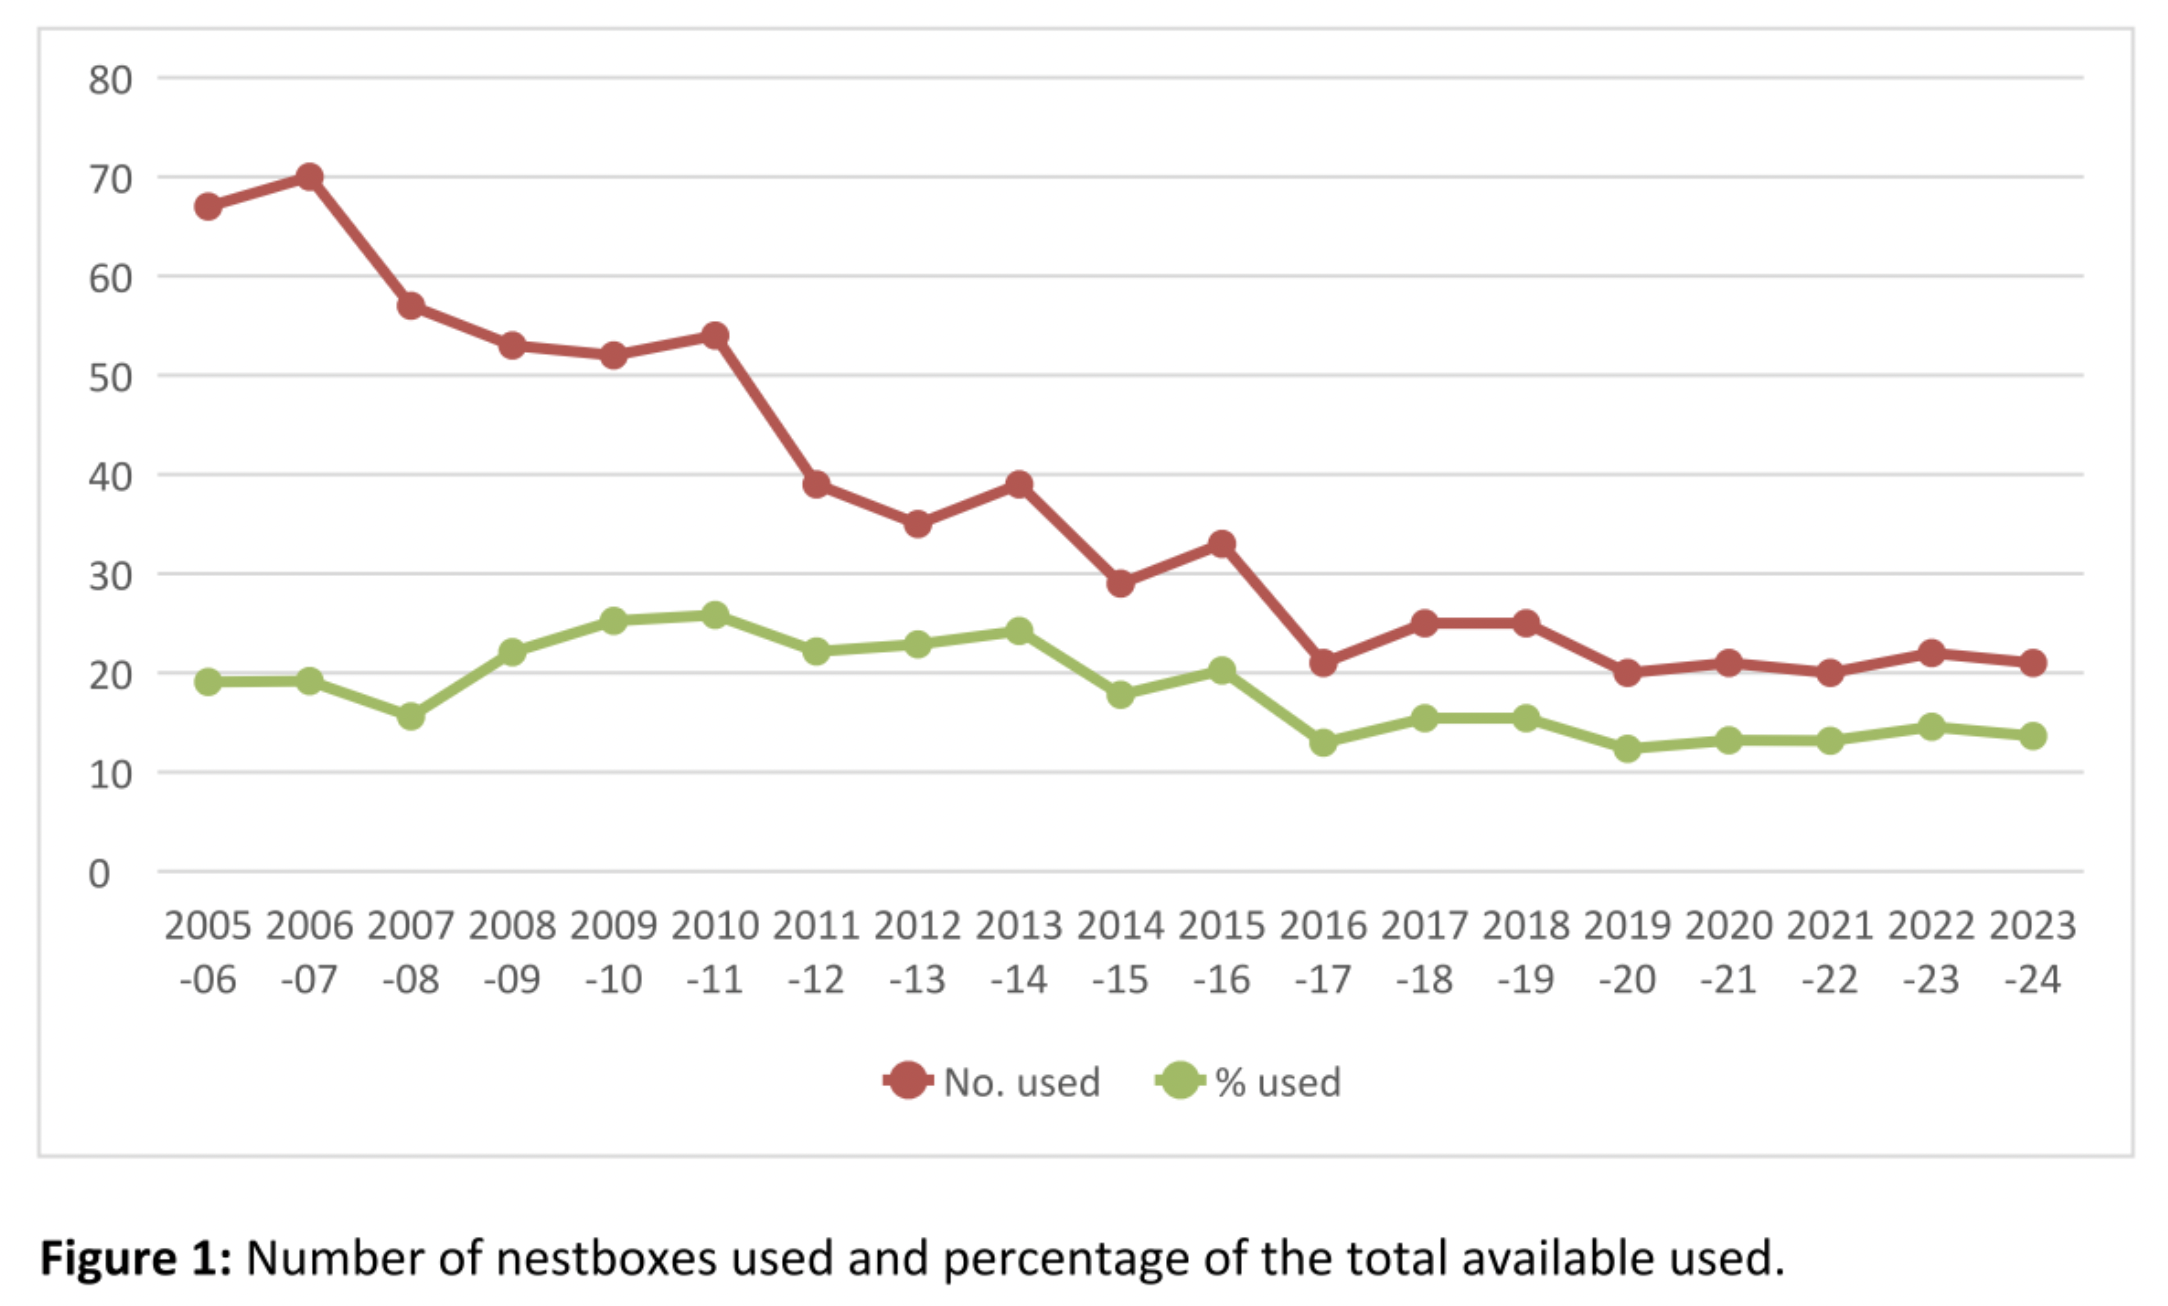
Figure 1 shows that, over the past eight years, fewer than 30 boxes per season have been used by tīeke, indicating that a large majority of the birds are using natural sites. Why do we continue to provide nest boxes at all if there are plenty of other sites for the birds to use? Because, although the birds may no longer need them, they have continued to use a proportion of them each year and, in doing so, they provide us with a mechanism for observing their breeding behaviour and gauging their success. Ideally, to observe all the significant events in the life of a nest (building, lining, egg-laying, hatching, chick growth, and fledging), nest boxes should be checked every seven to ten days. This has been done consistently since 2010, with the exception of the two seasons between 2021 and 2023, when Covid restrictions and the pressure of other work made it impossible. The very welcome recruitment of eight new volunteers in 2023 has enabled regular monitoring to be resumed.
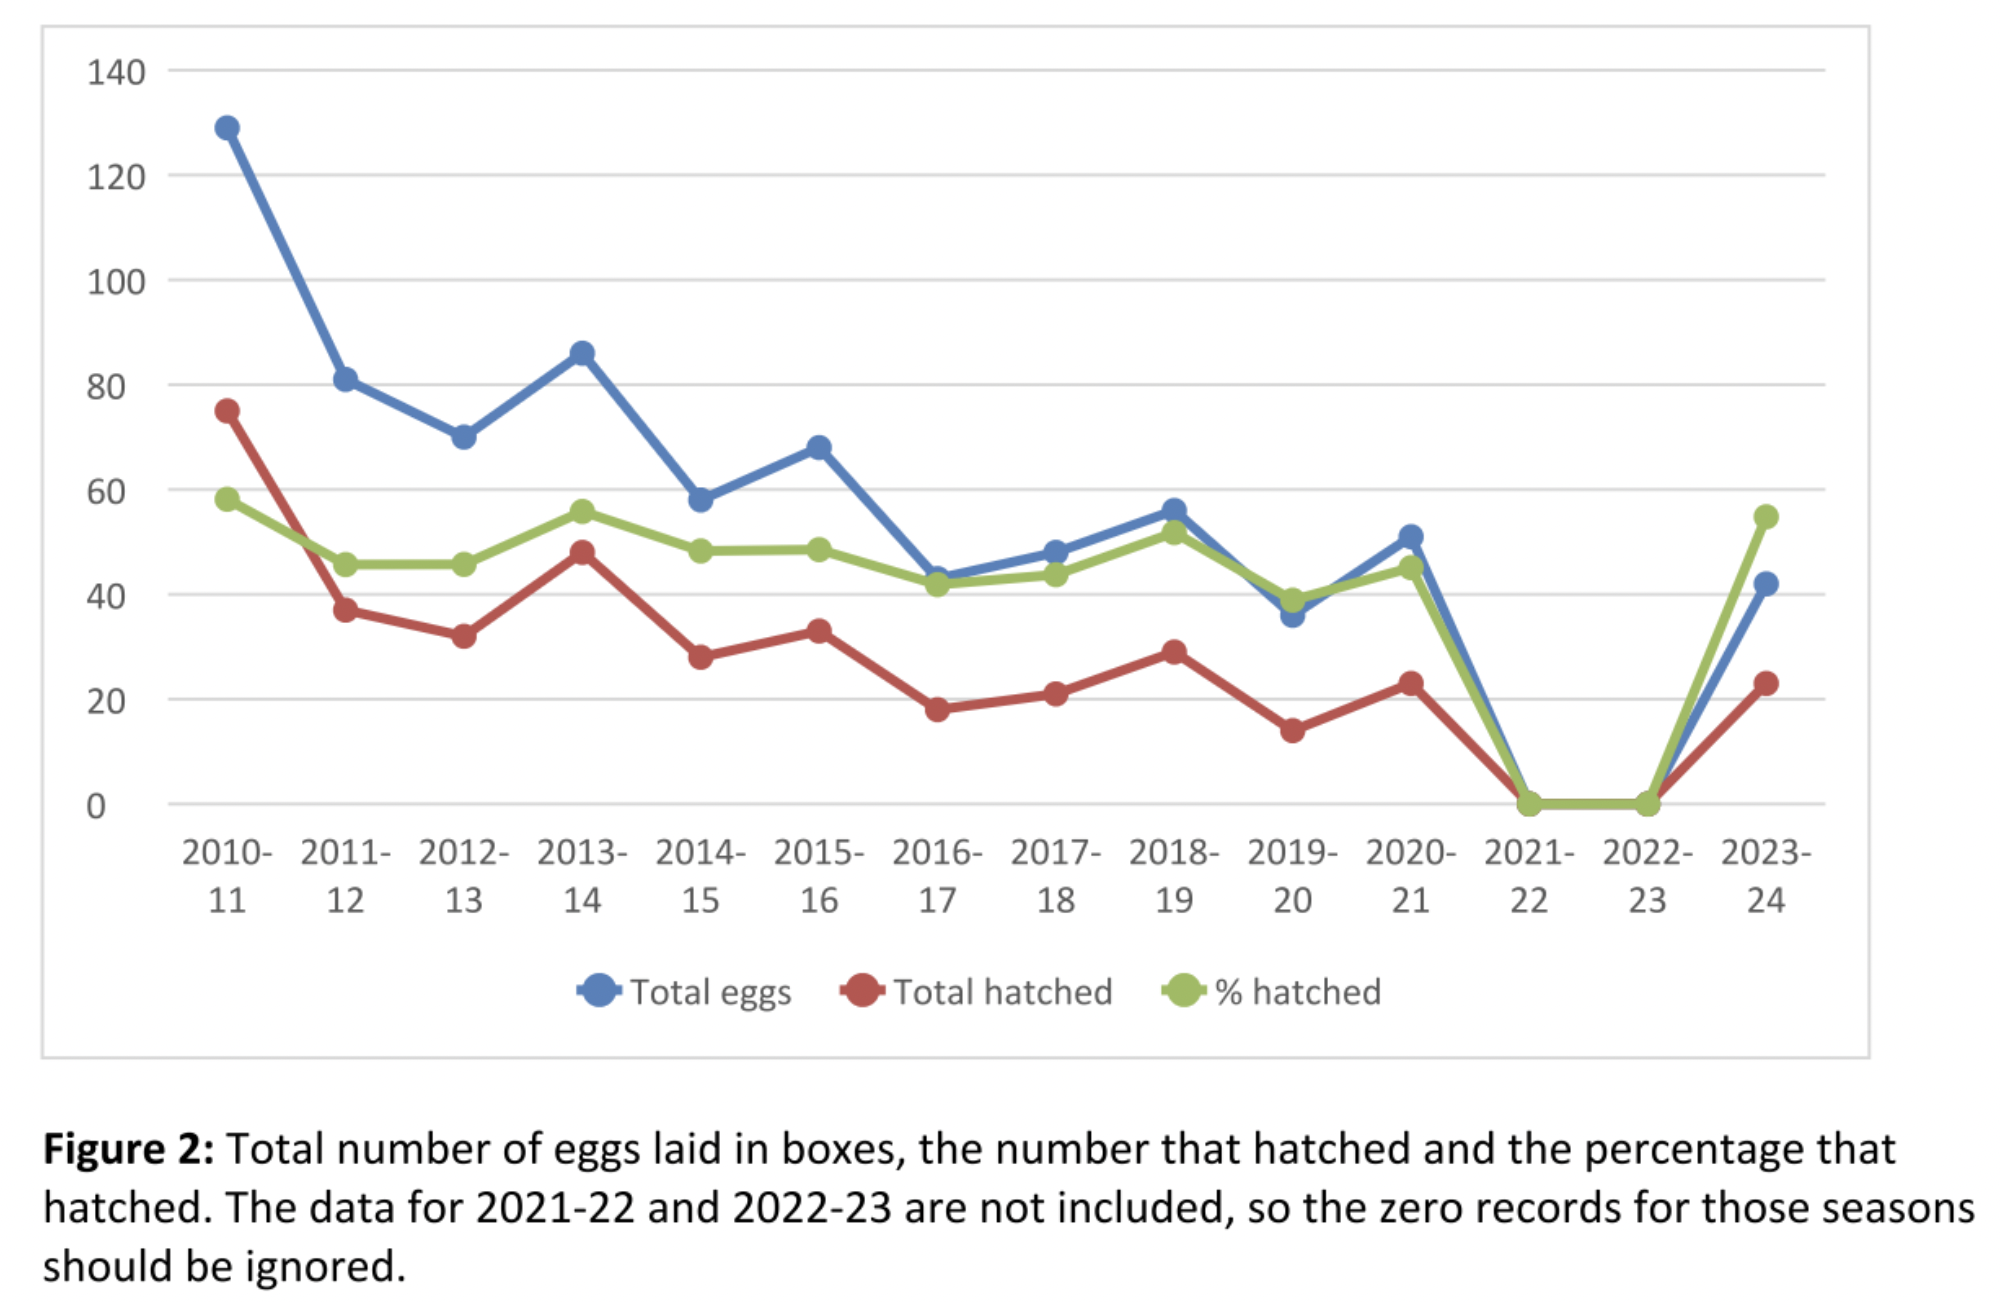
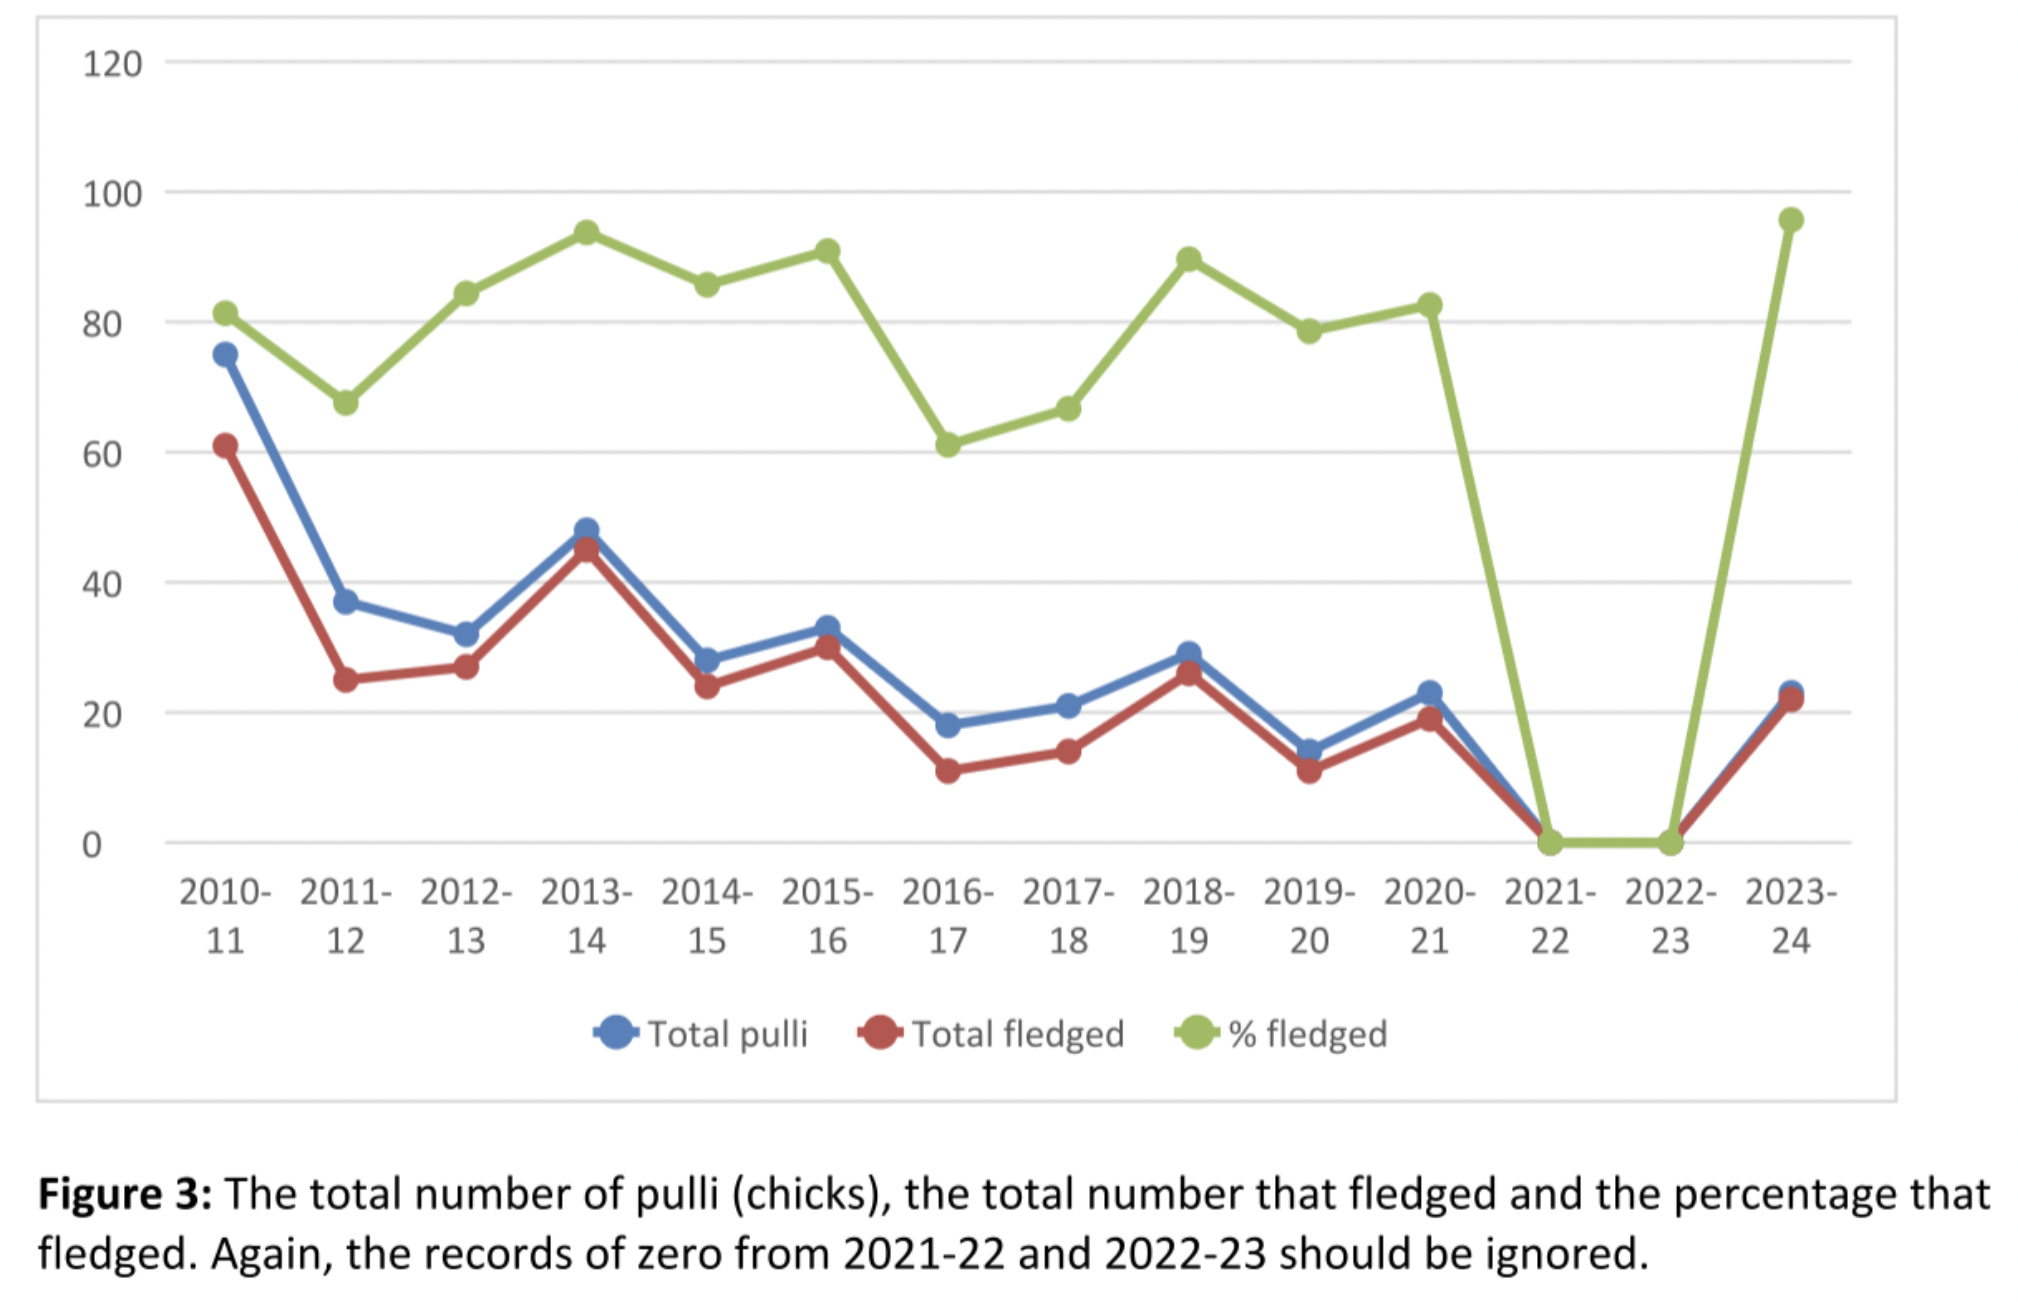
So what can we learn from the years of observation? Figures 2 and 3 are based on data from 2010-11 onwards (excluding the two seasons referred to above). They show that the numbers of eggs and chicks fluctuate from year to year but that there are longer-term trends to observe. Not surprisingly, the number of eggs laid, the number that hatch (Figure 2), and the number of chicks raised to fledging (Figure 3) have declined as the number and percentage of boxes used has declined (Figure 1). But while it is tempting to assume that this is because more natural sites are available, this is probably not the whole story.
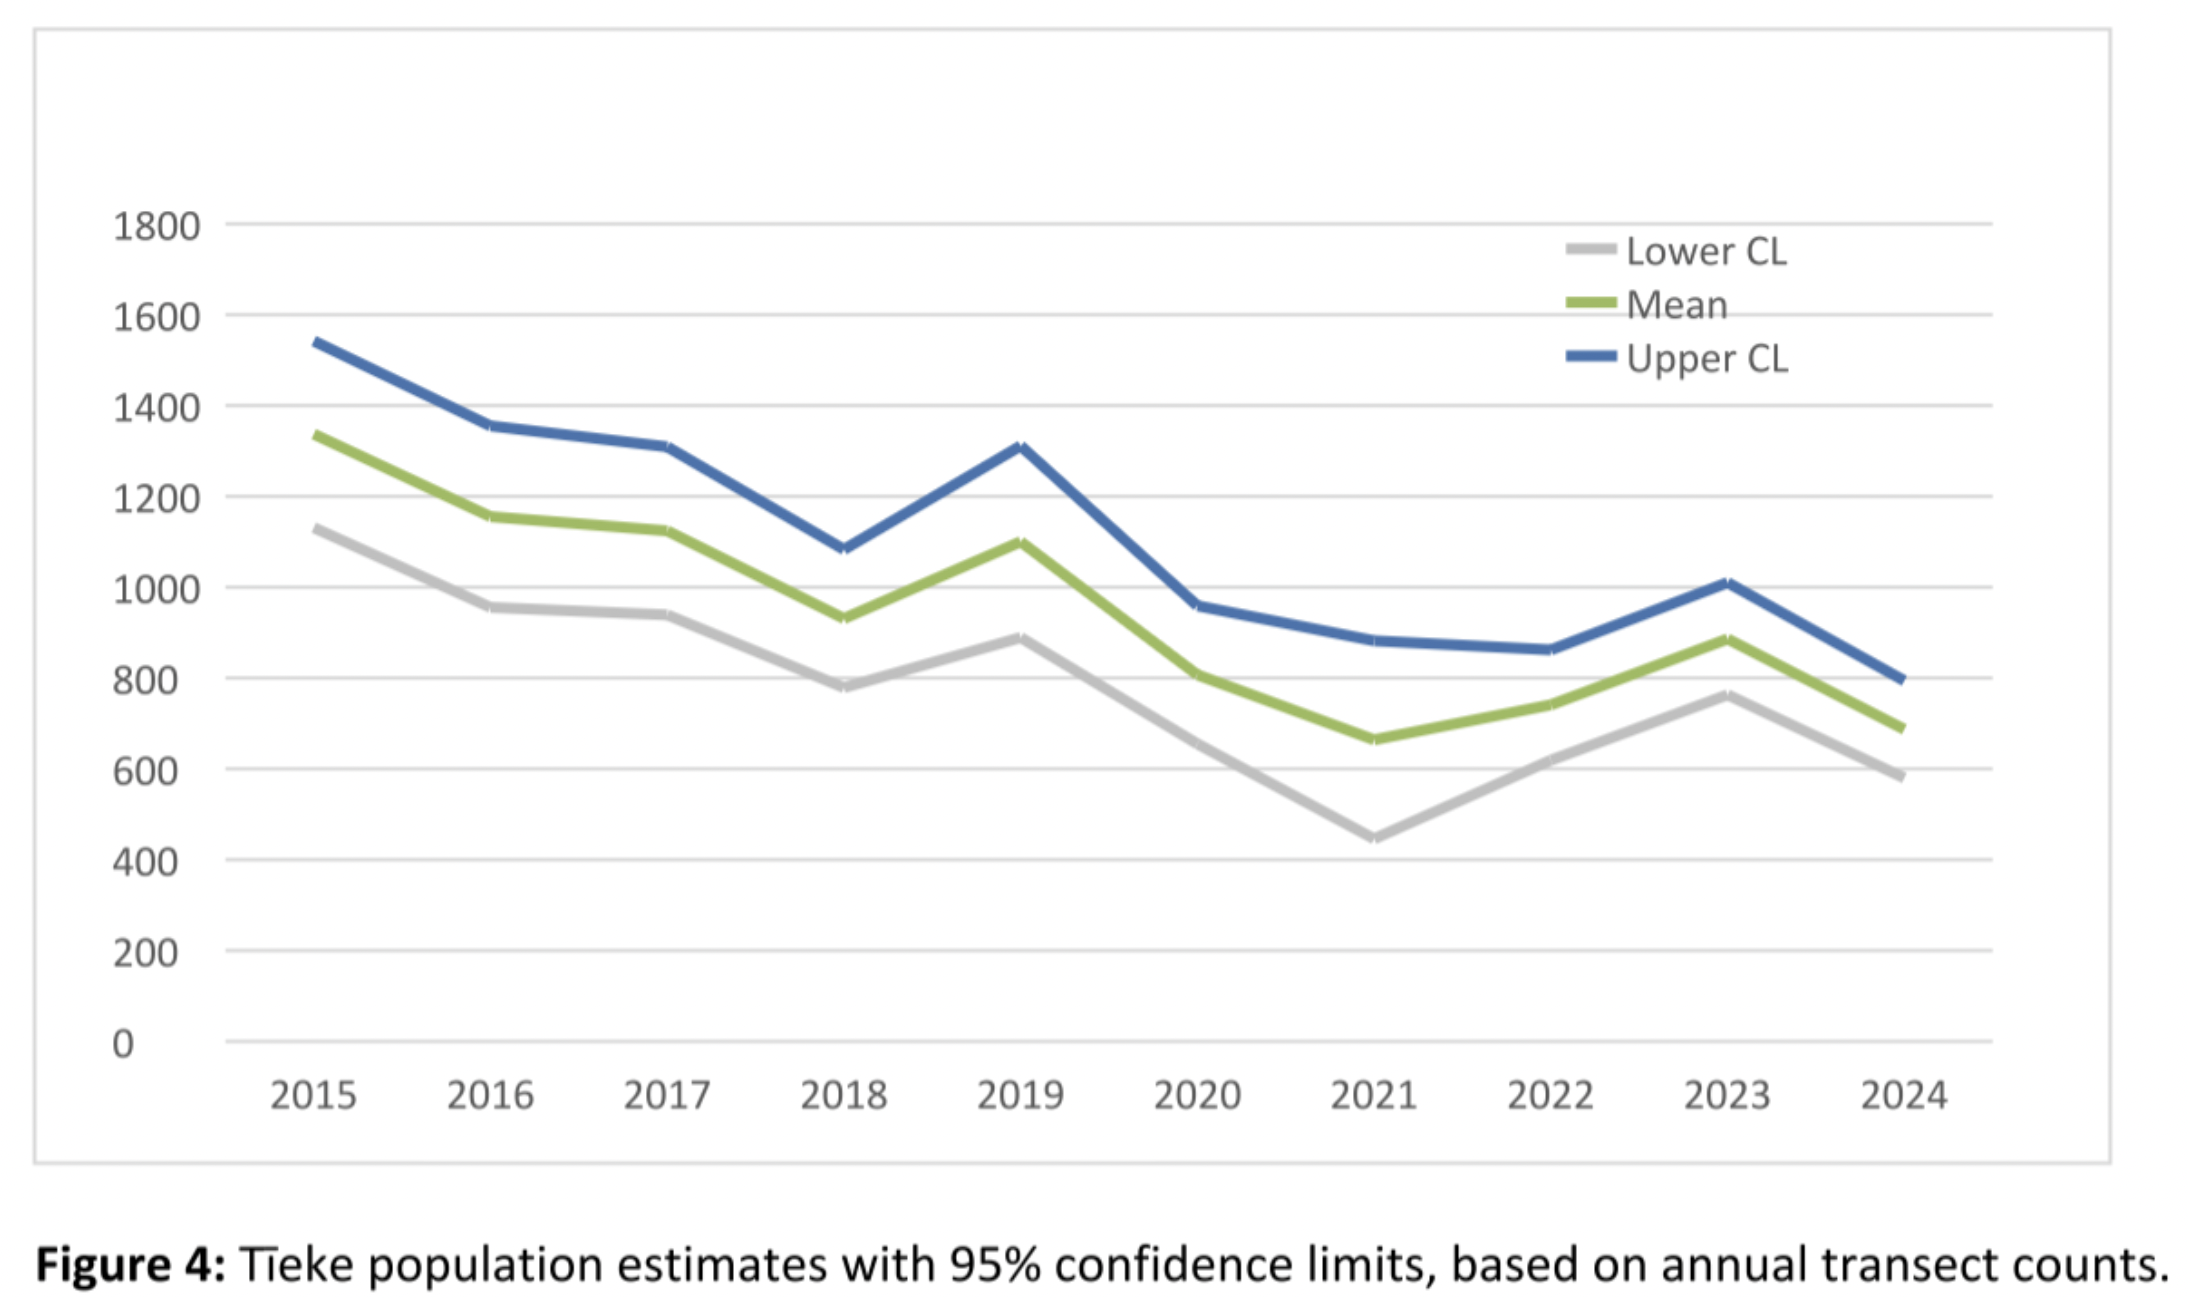
Figure 4 is based on data from the annual bird transect survey, which started in 2015. It shows that, while there have been shorter-term fluctuations, the total population of tīeke on the Island is now slightly more than half what it was in 2015. So the declines observed in nest boxes could simply be a reflection of the decline in population.
Figures 2 and 3 also indicate the percentages of eggs that have hatched and chicks that have fledged. Since 2010, 40-60% of the eggs laid each season have hatched, and a more variable 60-95% of the chicks that hatch each season have been raised to fledging. Last season (2023-24) was the most successful on record, with all but one of the chicks hatched in boxes having fledged.
It is clear from all this that the data from the nest box scheme can inform us about annual and longer-term changes in tīeke breeding behaviour and outcomes, but understanding these changes requires a much broader range of information on other components of the Island’s ecosystem. Some of this is available from Supporters of Tiritiri Matangi projects already underway (such as the transect survey mentioned above), some will come from projects planned for the future, and some is available from other sources (such as local weather records). What is certain is that, to understand what is happening to the tīeke on Tiritiri, we just have to keep checking and counting.
Celebrating 40 years of tīeke/saddleback
Celebrating 40 years of tīeke/saddleback on Tiritiri Matangi
Celebrating 40 years of tīeke/saddleback on Tiritiri Matangi
Author: Stacey Balich, Guide
Date: May 2024, Dawn Chorus 137
Header image credit: John Sibley
In 1984, 24 tīeke/saddleback from Cuvier Island were released on Tiritiri Matangi. They quickly established themselves with the help of nest boxes, roost boxes and regenerating bush. This year marks the 40th anniversary of their arrival, and, to celebrate this, Barbara Walter shared with me her experiences and stories from the early years. Dr Tim Lovegrove (Auckland Regional Council Heritage Department scientist) coordinated the translocation from Cuvier Island. The 24 tīeke, comprising six breeding pairs and 12 juveniles, came from five different areas of Cuvier Island and had distinct dialects. In order to preserve these distinctions, they were released in five different areas on Tiritiri Matangi: Bush 1, Bush 2, Wattle Valley, Bush 21, and Bush 22 (see Figure 1).
At the start, 360 nest boxes were made by the North Shore Forest and Bird branch, coordinated by Eric Geddes, who used to travel to the Island on a small runabout from Army Bay. There were some differences in how the boxes were made. Some were short and some were long, both types having a V shape for the opening. Later a grill was added to the opening to prevent mynas and ruru from getting in, especially ruru, as they were getting in and stealing the eggs. John Craig and Marijka Falenberg were the first to monitor the tīeke, and when Marijka finished John asked Barbara to continue with the project. She remembers going out at night with John and Marijka to monitor the nests, and she couldn’t keep up with them because they had longer legs than her.
Barbara was tasked with the responsibility of checking the boxes once a week during the season, and twice a week when eggs were hatching. This was quite a laborious task, which required a great deal of dedication, attention to detail, and physical exertion. Ray prepared dinner for them on the days when Barbara was occupied with checking the boxes. Barbara and Ray also used to band the tīeke chicks in the nest boxes.
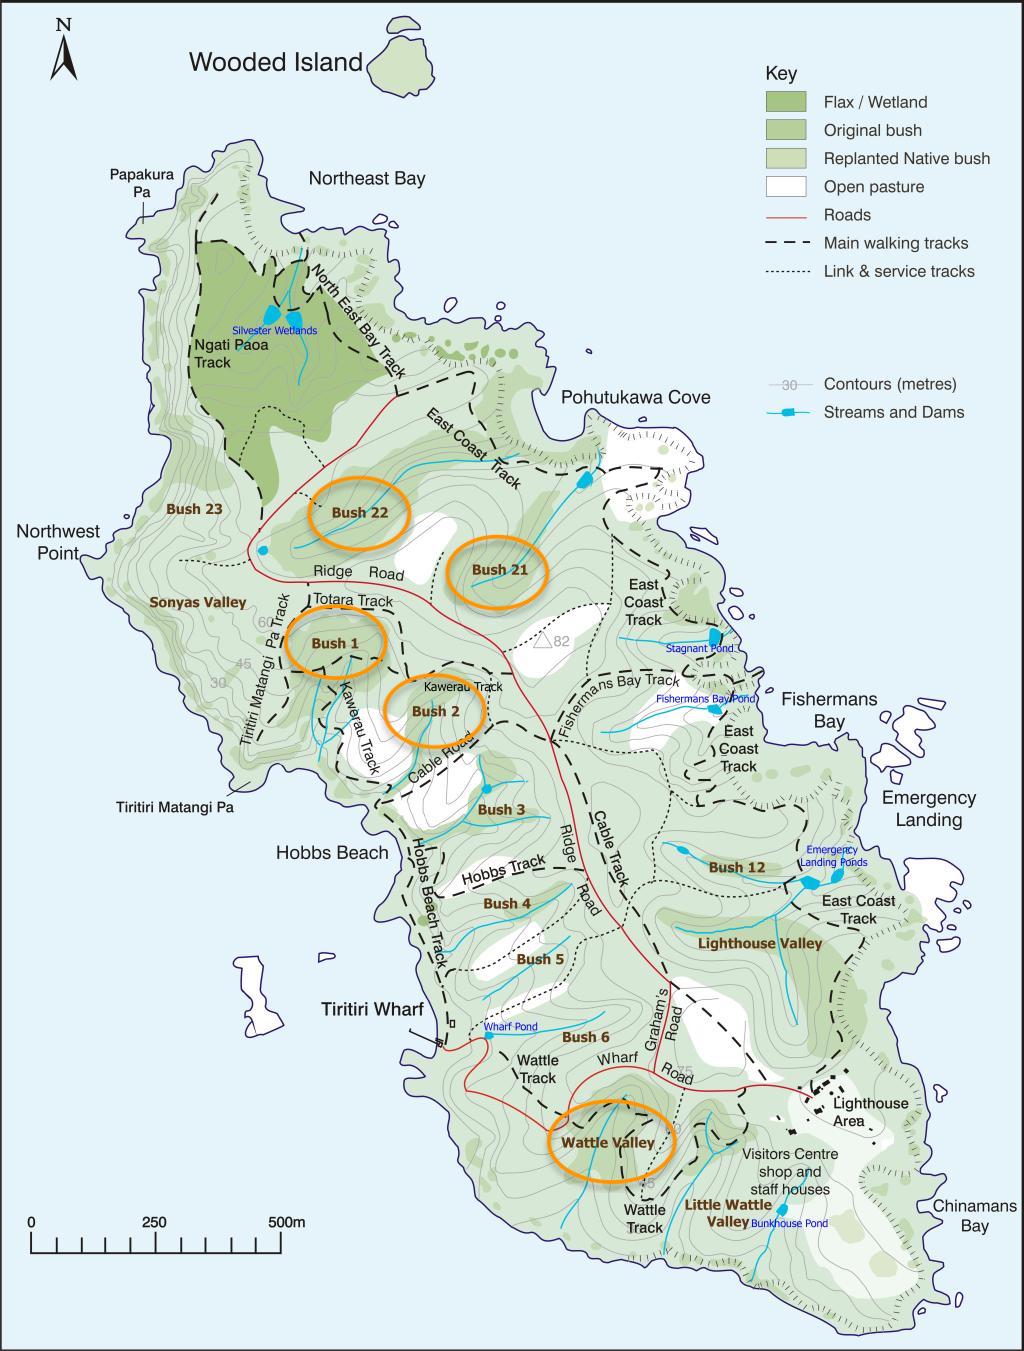
Left image: Figure 1: Map of Tiritiri Matangi Island showing the bush areas. Bush 1, 2, 21, 22 and Wattle Valley are circled.
Right image: Figure 2: Map of the North Island showing the tīeke translocations
Left image: Figure 1: Map of Tiritiri Matangi Island showing the bush areas. Bush 1, 2, 21, 22 and Wattle Valley are circled.
Right image: Figure 2: Map of the North Island showing the tīeke translocations
Tīeke are generally long-lived birds. Five or six of the original birds were still being seen in 1994 and two birds seen in 1998 had been banded back in 1978 and 1979. One female in Wattle Valley lived a long and fruitful life, reaching the impressive age of 21. Despite being a loyal and devoted partner, this tīeke had three different mates during her lifetime. Barbara mentioned that during one breeding season, she constructed multiple nests before selecting the perfect one to use.
In 1993, poisoned bait was dropped on the Island to eradicate the kiore (Pacific rat). Prior to this event, it was important to determine whether the tīeke would be likely to be affected by this, so bait was placed in some of the roost boxes. Fortunately, the tīeke showed no interest and the bait drop caused them no harm.
Photo credit: Kathryn Jones
A thriving tīeke population
During the early years, tīeke used to lay three or four eggs per nest. However, over time, Barbara noticed that the number of eggs laid gradually decreased. It is now known that this decrease in egg-laying is a natural mechanism that helps regulate the population of tīeke. By laying fewer eggs, tīeke can ensure that the number of chicks hatching each year is balanced with the available resources in their habitat.
By the 1990s, the tīeke population was thriving. As the trees grew taller they had more natural places to build their nests, such as in the punga and harakeke/ flax bushes. In 1991 there were 60 pairs who produced 117 chicks and during the next season, there were 147 chicks. As a result of this productivity, the Island became a source for translocations to other sites. Barbara described how mist nets were put up and tīeke calls were played to attract the birds to catch them for translocations. The first translocation, to Otorohanga, took place in 1990, and many successful translocations followed (see Figure 2 above). Barbara remembers Ray being asked to go with the tīeke to Moturoa in the role of kaumātua.
Barbara said that she found herself busy with the planting and handed the monitoring over to Morag Fordham, who had been outstanding and, without
her help, the Island’s tīeke programme would not have been the huge success it has turned out to be.
Soil: what helps create and maintain it
Soil: what helps create and maintain it
Soil: what helps create and maintain it
Author: Libby May, Guide
Date: September 2024
Healthy soil is fundamental to our continued healthy life. It provides plants, filters and manages the volume of rainwater, hosts an enormous biodiversity both above and below ground and it can tell us about our past as well as protect our future.
It’s a huge carbon pool, absorbing carbon dioxide from the air – 1,500 billion tonnes of carbon globally – almost three times more carbon than in all above ground biomass including trees, shrubs and grasses. According to the Land Care Research Soils portal, each year unsustainable land management around the globe is responsible for around 24 billion tonnes of fertile soil being contaminated, washed off the land or blown away by the wind. In New Zealand it’s 192 million tonnes a year. (1)
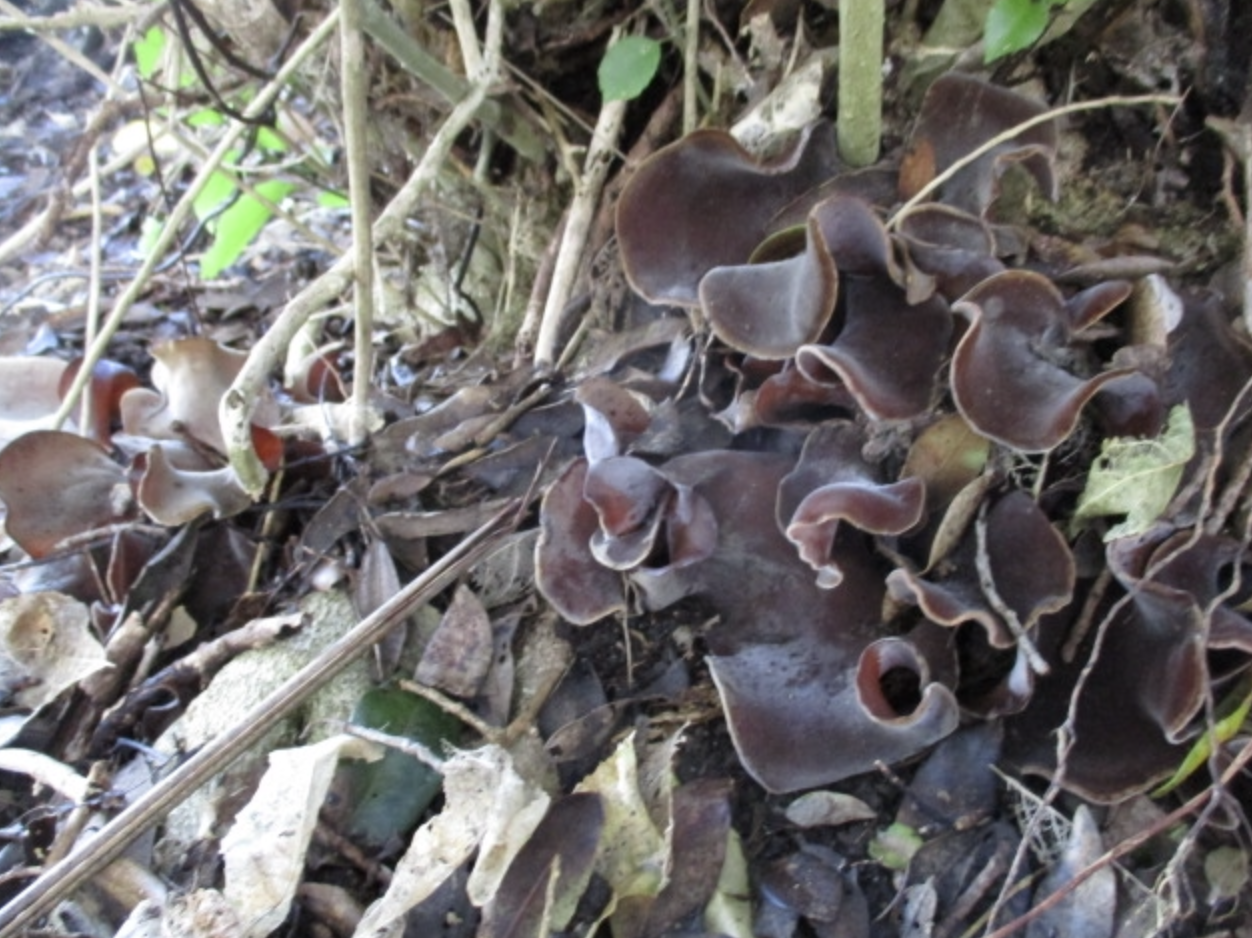
It’s not a speedy process, creating healthy, rich, fertile soil. Its origins start with bare rock and sediment surfaces being weathered and disintegrating under the influence of climate. Over time the surface becomes available to vegetation, lead by lichens (of which we have an abundance on Tiritiri Matangi) which will root in any cracks they can find such as the greywacke we see on the Wattle Track. A thin layer of vegetation will gradually build up and in the fulness of time start decomposition which in turn produces organic acids. These help break down the initial material. As life increases on the surface, biological, chemical and physical weathering continues beneath.
There are more species of organisms in the soil than there are above ground; a handful of soil contains millions of individual living organisms. They help break down animal wastes, fallen leaves and other dead flora as well as fauna and turn it into humus which they then distribute throughout the soil. They also help with maintaining soil structure and water filtering. These include earthworms, lice (of the wood variety), spiders, springtails (a favourite of the North Island robin – New Zealand has two of the largest known in the world, Holocanthella, which can be up to 17mm long compared to the average 1-3mm) and mites, plus microorganisms – bacteria, fungi and archaea.
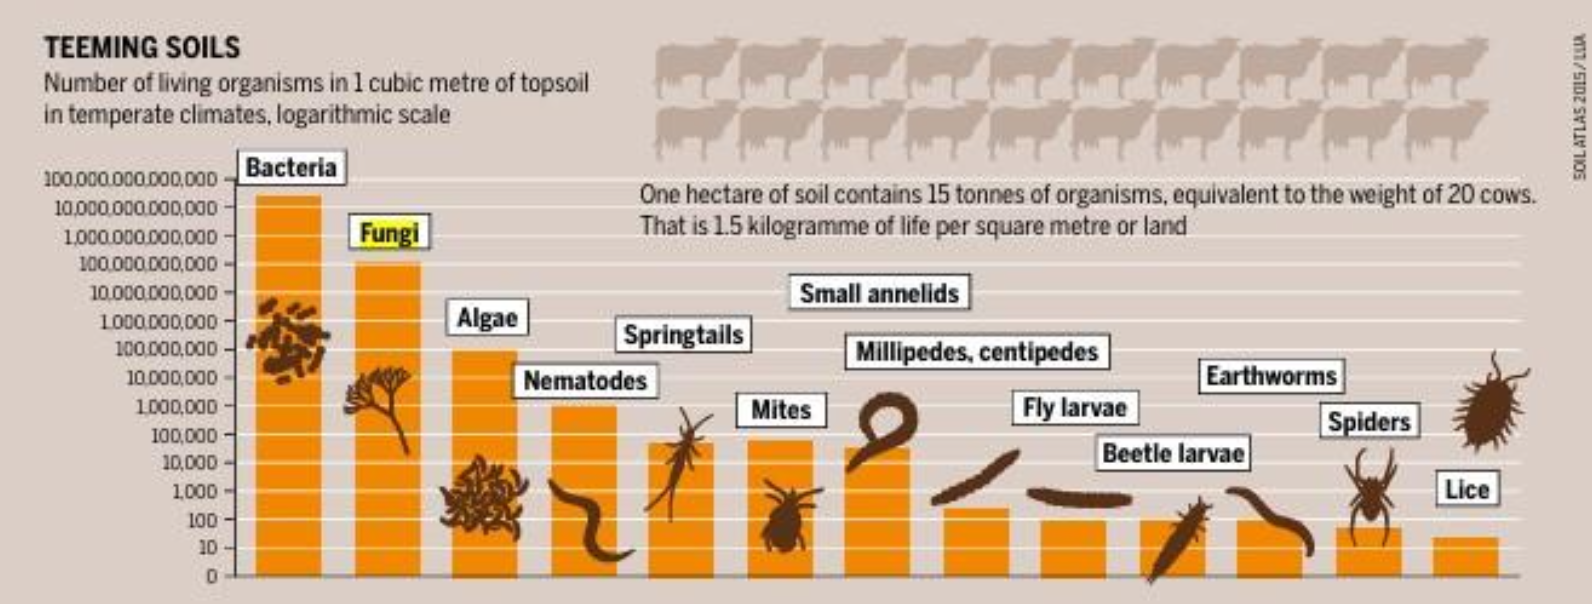
Photo credit: Taken from the publication referrenced below under “Creative Commons”
Photo credit: Taken from the publication referrenced below under “Creative Commons”
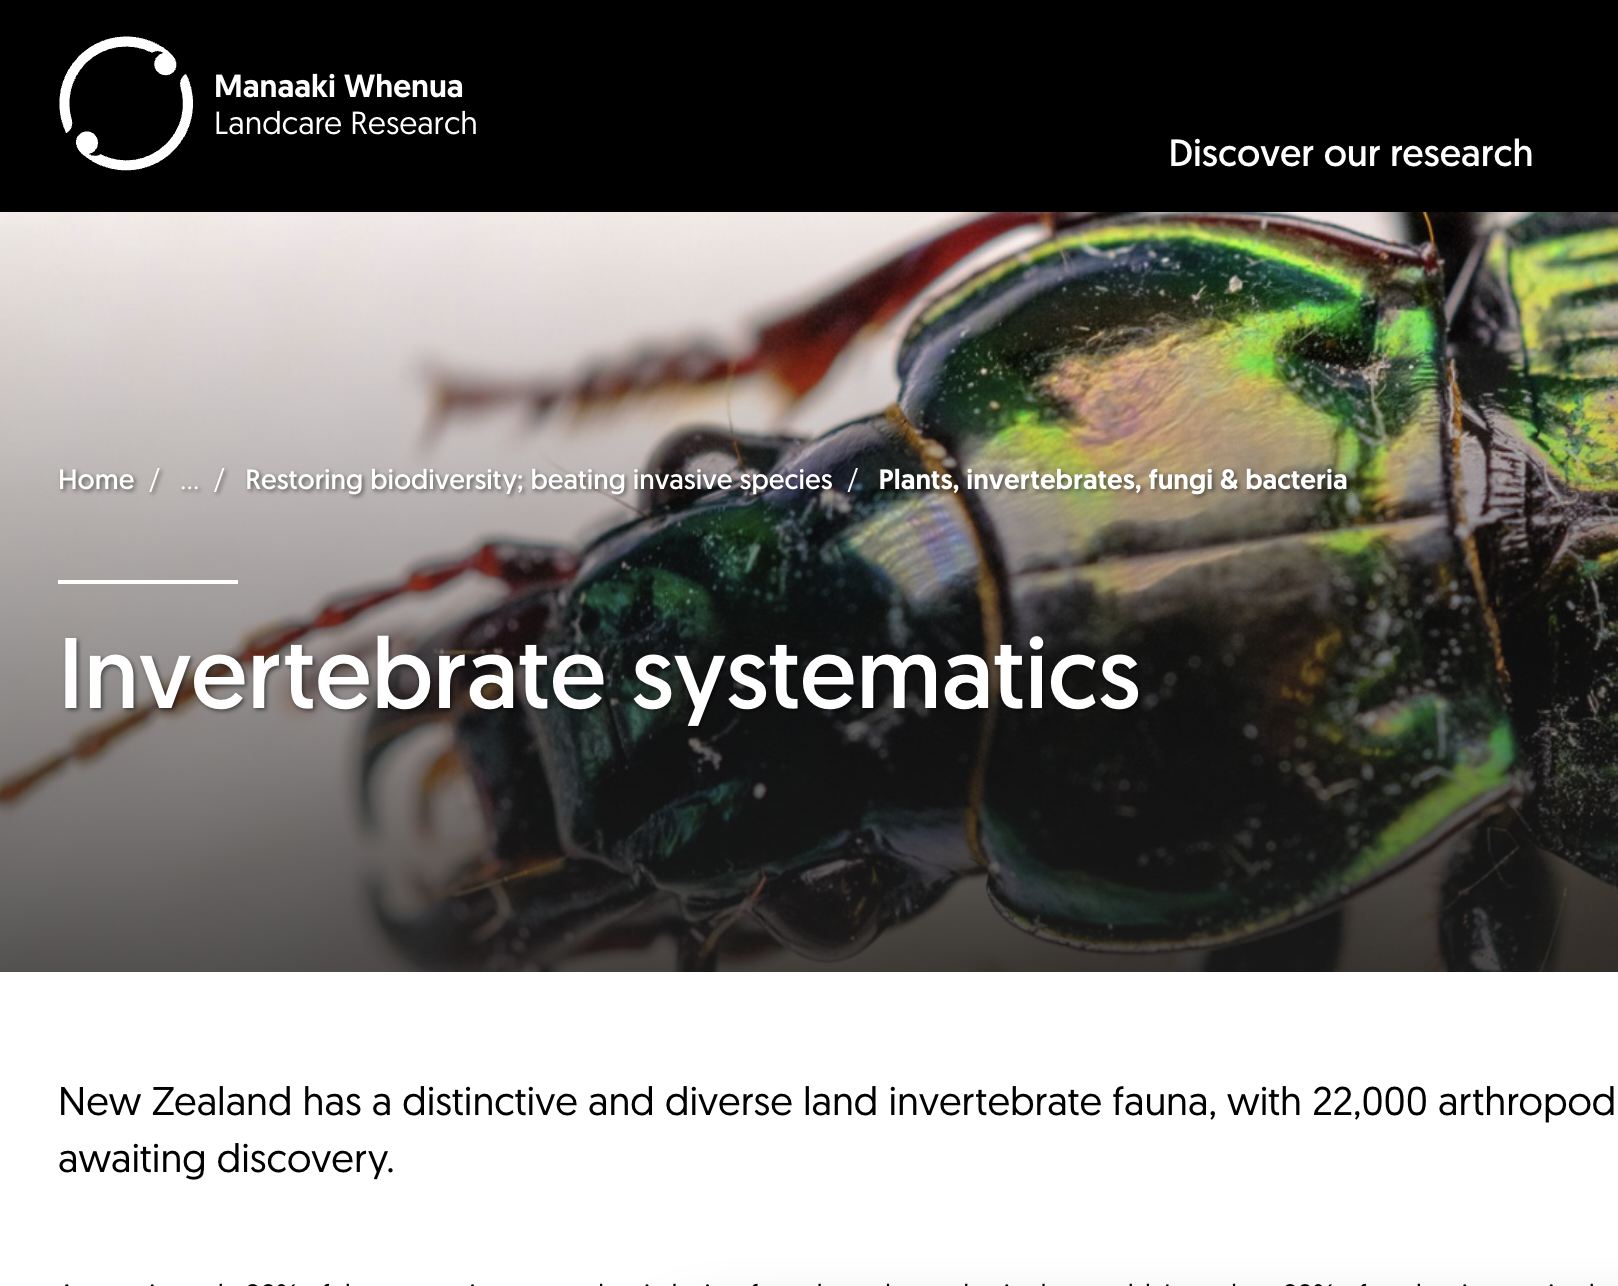
To give some scope to this vast biodiversity, the Land Care Research page on Invertebrates states there have been 22,000 arthropod species described, with at least that number again waiting to be discovered. Of that approximately 80% are endemic.
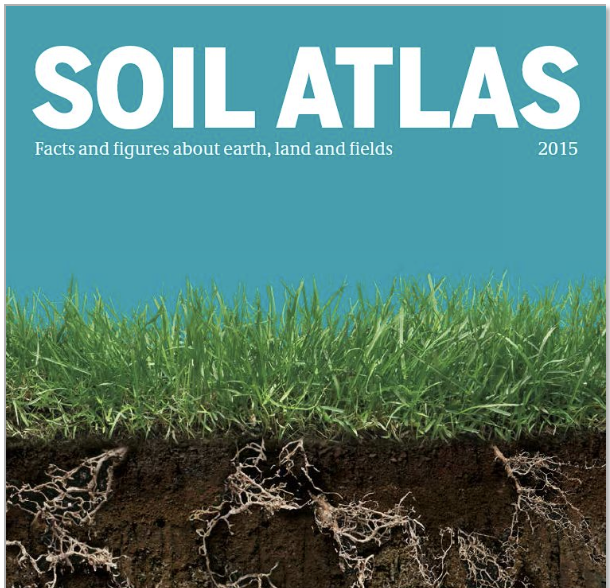
For more information on this fascinating subject follow any of the links provided, or download the ‘Soil Atlas: Facts and figures about earth, land and fields’ publication link below: It’s a 68 page free download.
1 Bartz et al. (2015). Soil Atlas 2015 – Facts and figures about earth, land and fields. Heinrich Boell Foundation. Institute for Advanced Sustainability Studies. Potsdam, Germany. 4th edition.
Click here to visit the Soils Portal

Click the image to visit landcare research website
Click here to view the soil atlas
Spring has definitely sprung!
Spring has definitely sprung!
Author: Neil Davies, Guide
Date: September 2024
Photos credit: Neil Davies
Sunday 1st Sept.
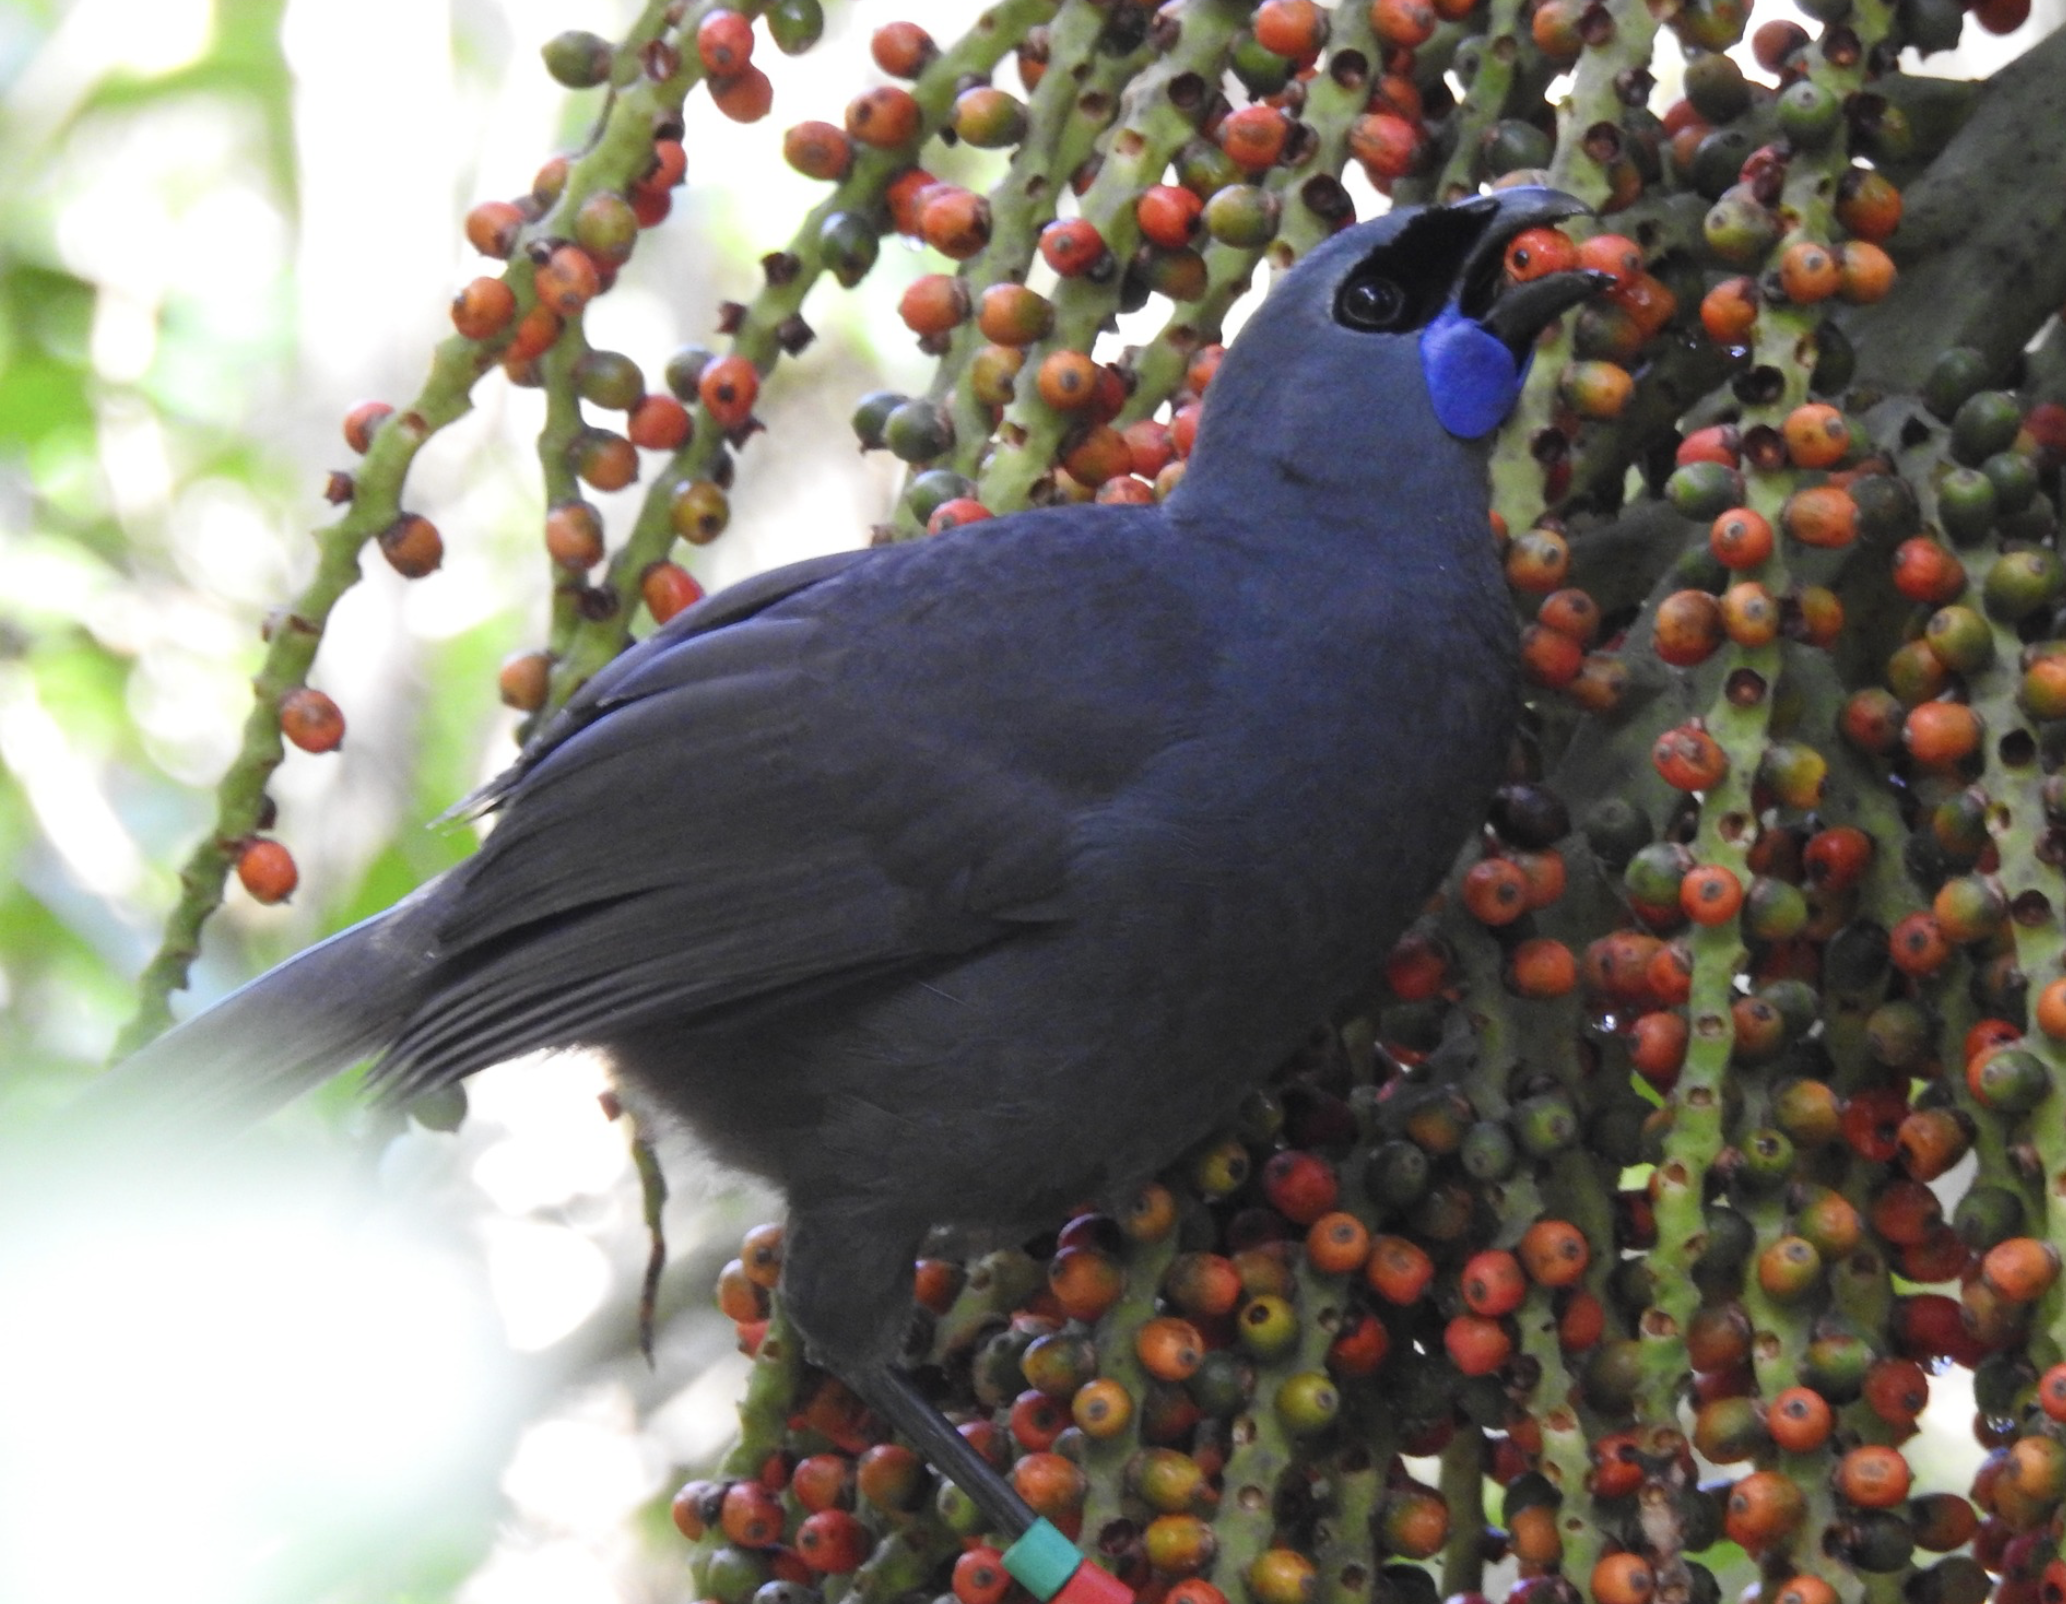
On Sunday Mary-Ann and I were over on the island checking tracking tunnel cards as part of our on-going monitoring programme. Nothing untoward and just the usual critters showing up on the cards – footprints of birds, weta, wētā punga, skinks, tuatara and Duvachel gecko to name a few. However, it was impossible not to be taken by the level of bird song, even in the middle of the day, which indeed sounded like the ‘dawn chorus’. There were lots of encounters with kōkako, hihi, korimako, tūī, pōpokotea and tīeke as well as several tuatara spotted outside their burrows. I think they were celebrating the return of sunshine and mild temperatures after the heavy rain, thunder and lightning from the weather ‘bomb’ that passed over on Saturday night.
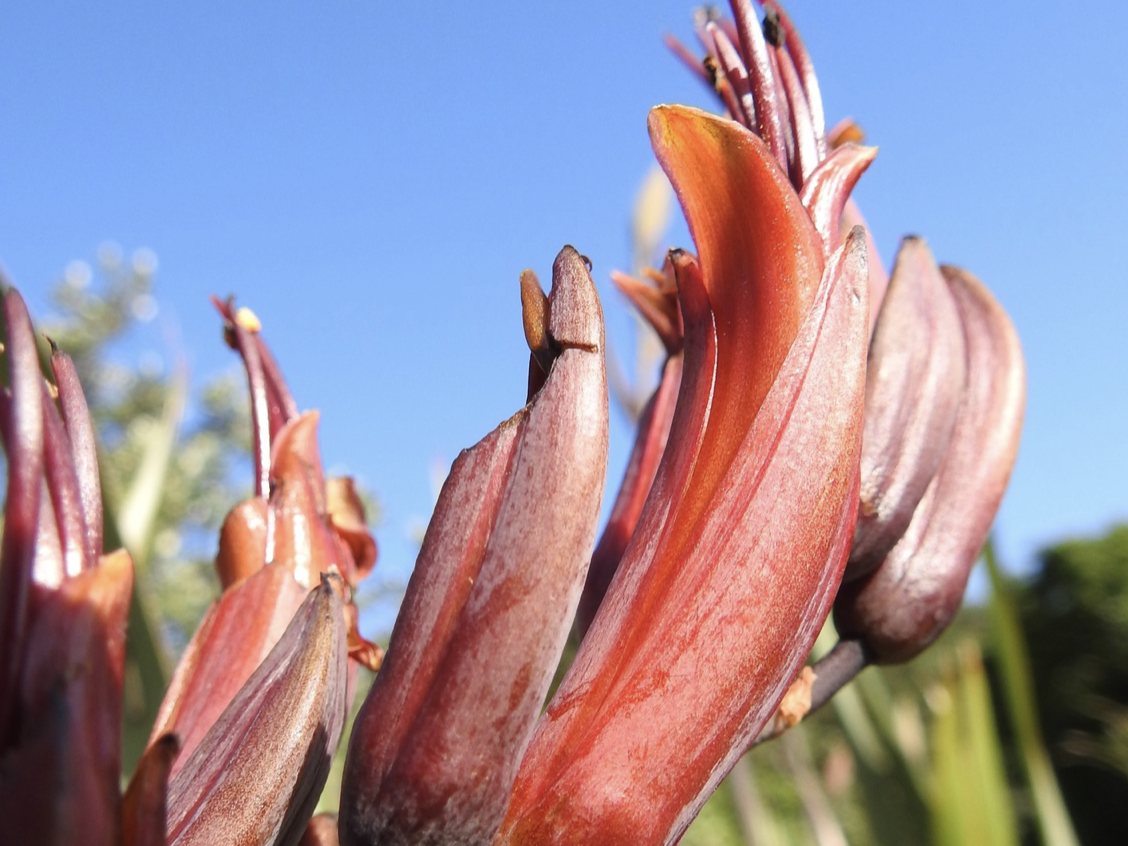
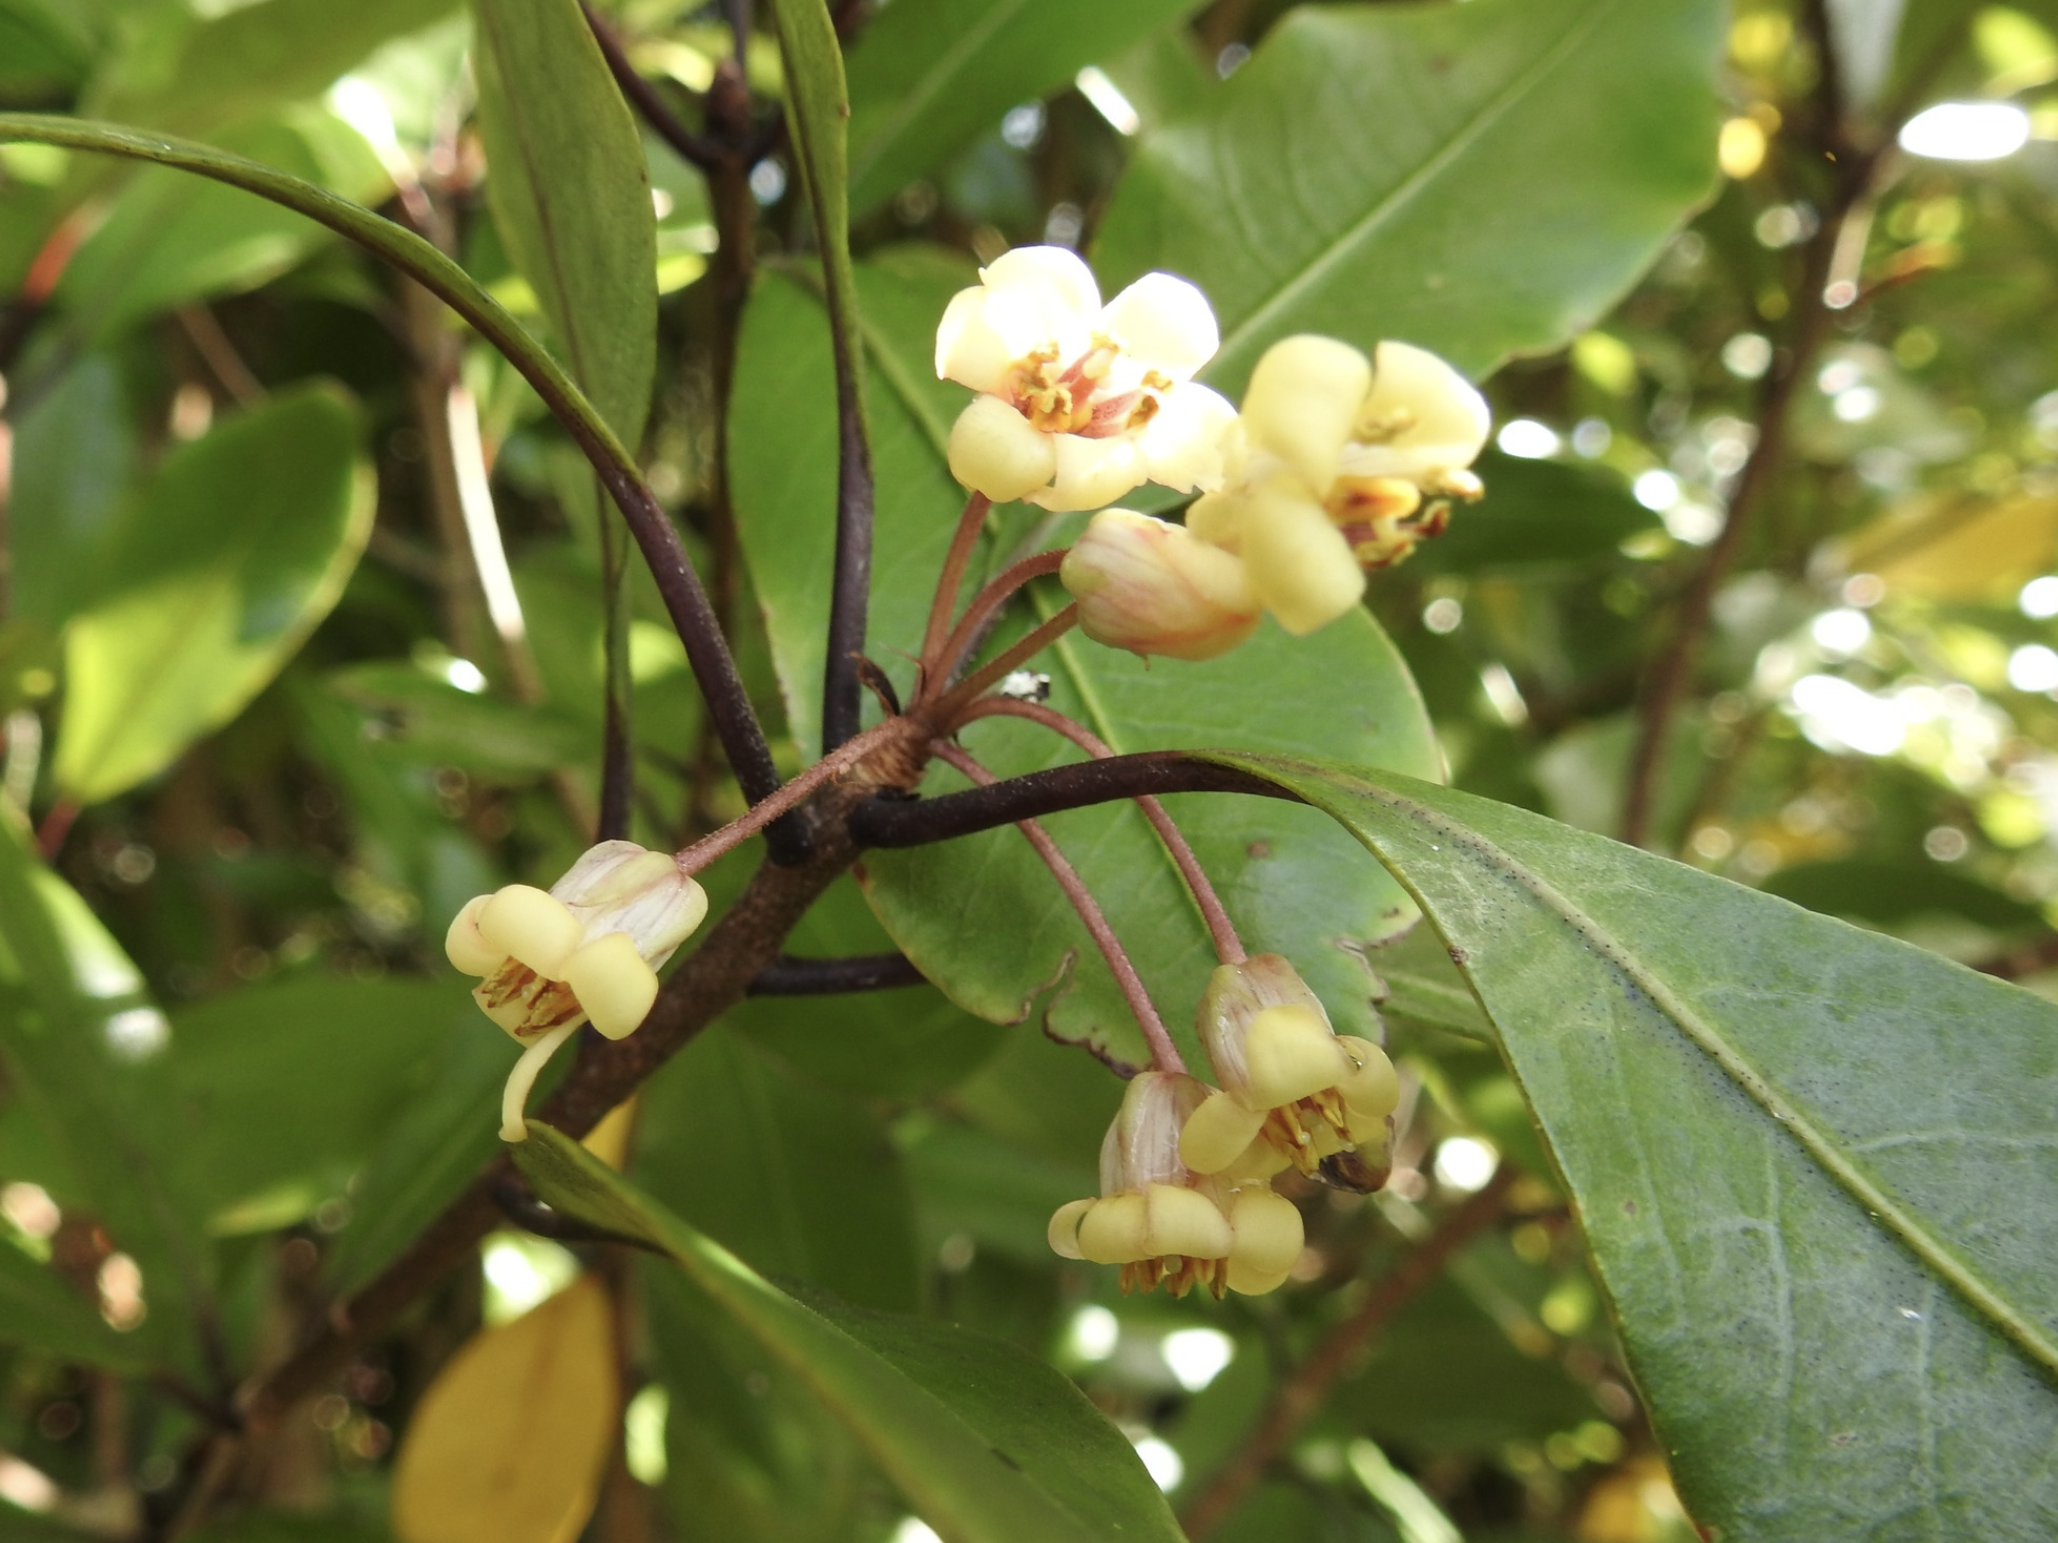
Things definitely seem to be warming up and Spring has definitely sprung! Kōwhai and karo are still blooming prodigiously all over the island and the ground is now being carpeted with yellow flower petals and the deep crimson colour of the karo flowers. It also looks like it’s going to be an exceptional year for harakeke (flax) with a huge number of flower spikes and the first flowers already opening (I haven’t seen any on the mainland yet). Rewarewa has started to flower too which also seems earlier than usual. So, plenty of food for our nectar feeders – tūī, hihi and korimako. Perhaps this means the birds will be breeding earlier this year!
Right now is a great time to visit the island (is there ever not a good time to visit?) I snapped a few photos and videos to capture some of those moments.
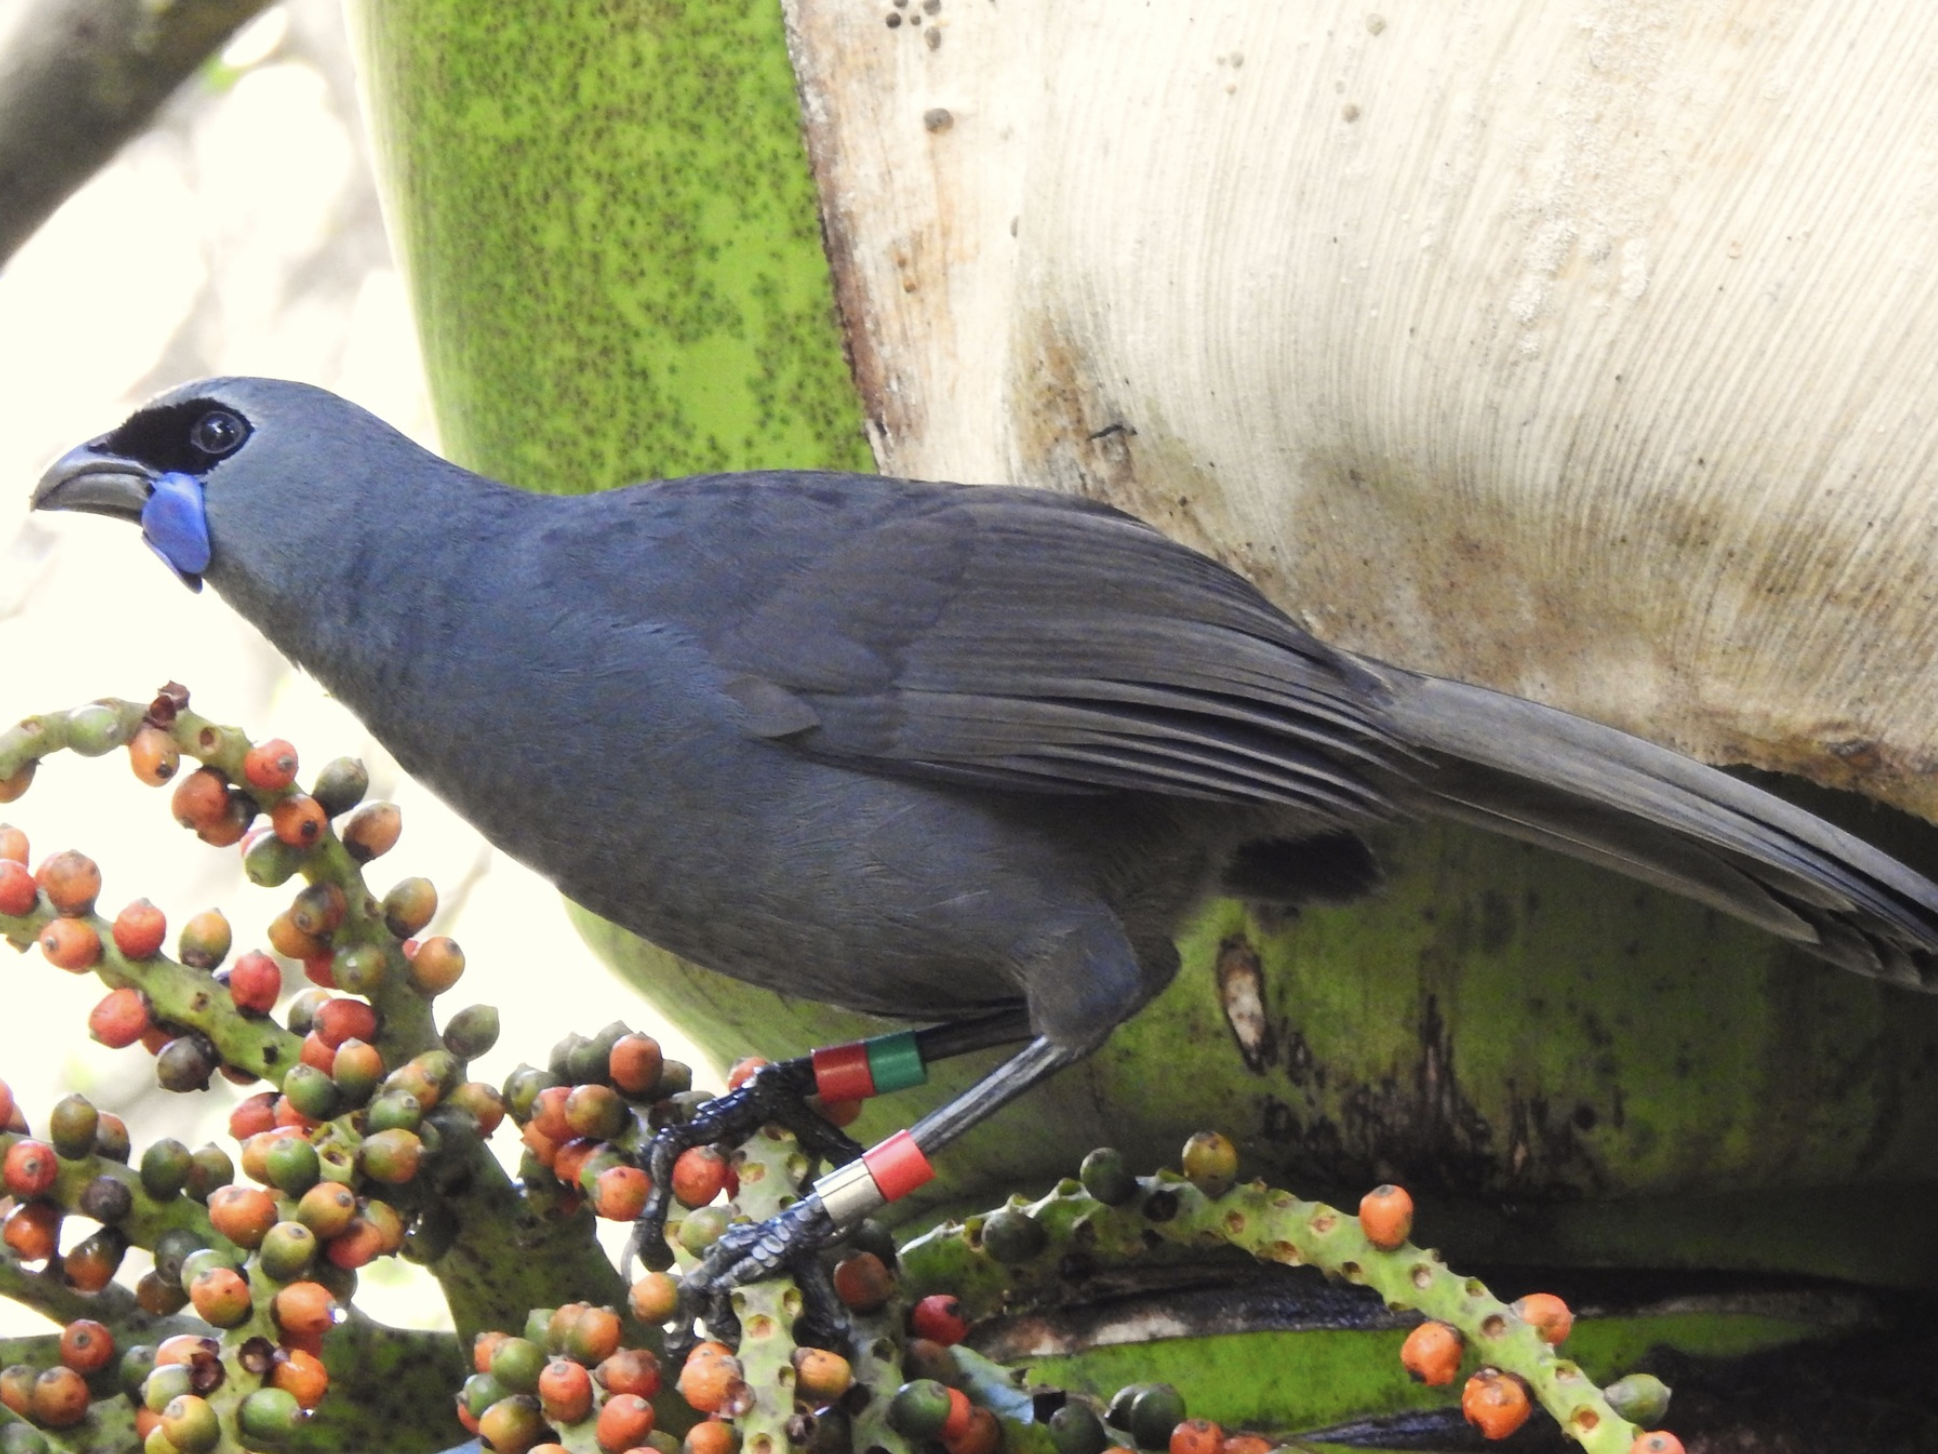

Kōkako enjoying the nīkau
Spring has sprung
Tropical newcomers thrive as our sea temperatures continue to increase off Tiritiri Matangi
Tropical newcomers thrive as our sea temperatures continue to increase off Tiritiri Matangi
Author: John Sibley, Guide
Date: August 2024
Photos credit: John Sibley
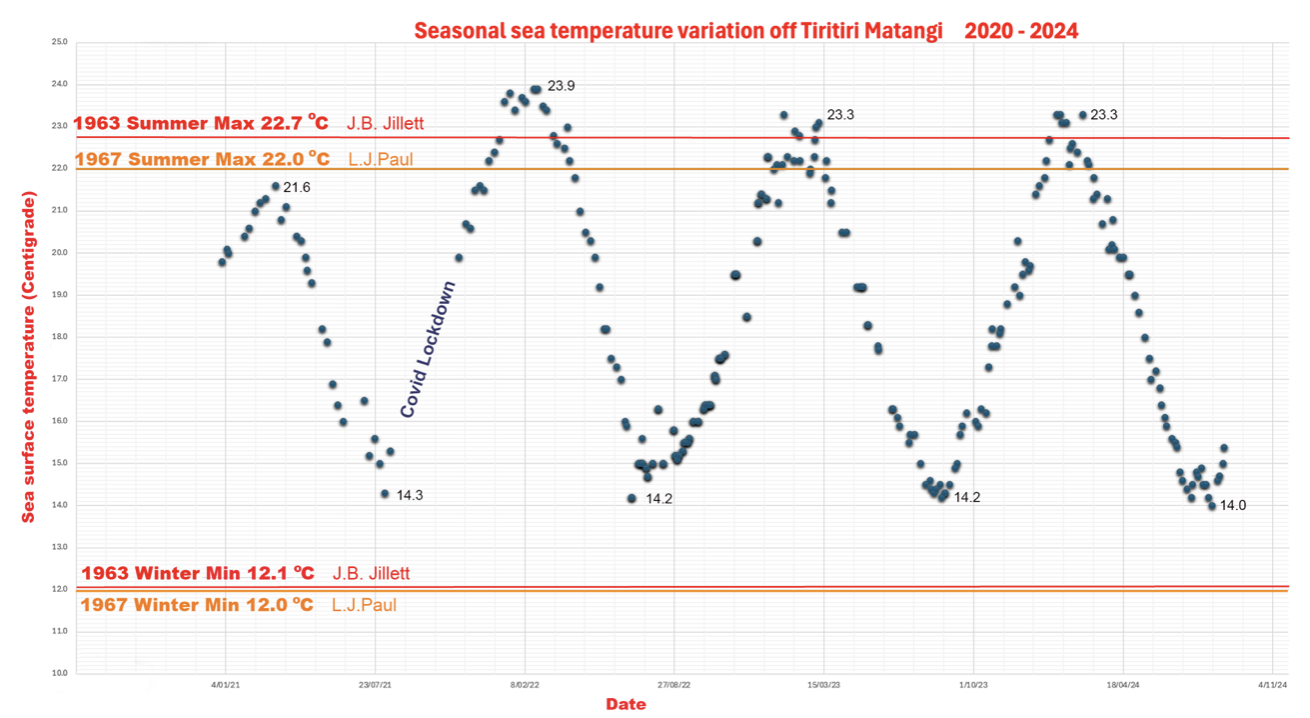
Once again in 2024 the winter minimum sea temperature off Tiritiri Matangi stayed two degrees higher than the historical recorded average 50-60 years ago.
At the same time two warm water species from the tropical North took advantage of this and were able to dominate the local marine ecology to the detriment of its indigenous residents.
The first species to appear in 2024 was the tropical toxic cyanobacterium Okeania, which now forms a permanent part of the seagrass community around the Gulf. Aided on by the half million tonne sewage spill from Parnell in October last year, Okeania grew rapidly in January to smother vast areas of seagrass.
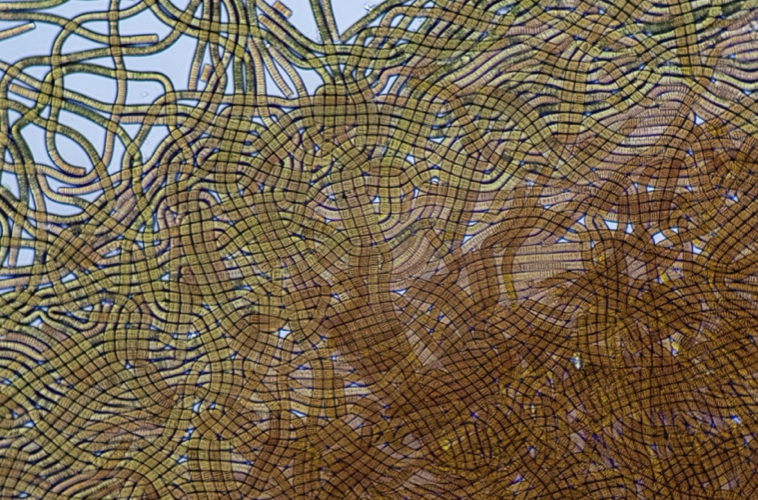
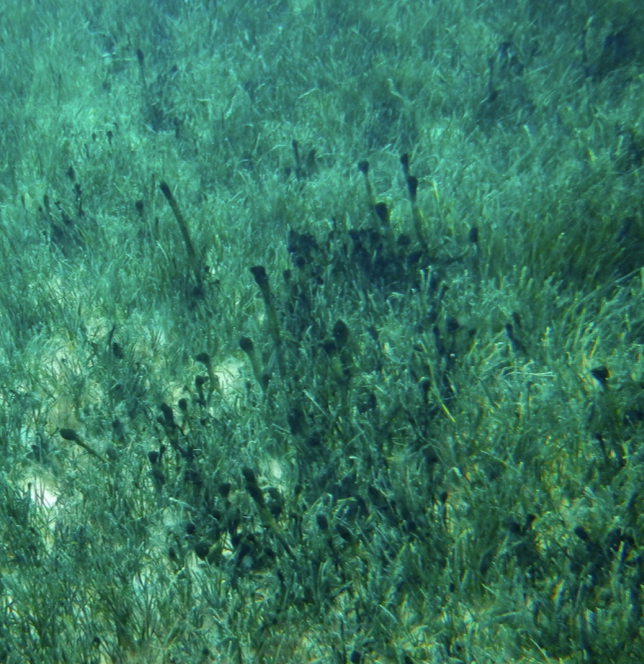
Left: Leaving a few strands on a microscope slide one sunny afternoon resulted in a tangled mass four hours laterRight: Off Tiritiri Matangi the seagrass beds were affected from the wharf to Hobbs Bay, with slimy fingers (picture above) breaking away and floating up to the surface just where swimmers love to come and cool down after a hot days walking.
Off Waikehe Island the council were called in to clear the resulting half metre deep layer of black slime off the beaches. Off Tiritiri Matangi the seagrass beds were affected from the wharf to Hobbs Bay, with slimy fingers (picture above) breaking away and floating up to the surface just where swimmers love to come and cool down after a hot days walking. The toxins produced are known to cause contact dermatitis, skin ulcers and even corneal perforations. Growth rates of this organism are truly impressive. When observing Okeania under the microscope, the strands are in constant rapid sliding motion as the cells divide. Leaving a few strands on a microscope slide one sunny afternoon resulted in a tangled mass four hours later, (See picture previous page) such was the astonishing growth rate. Since the sewage leak last year, amounts of the cyanobacterium have decreased, but it still forms a significant component of the changed seagrass ecosystem.
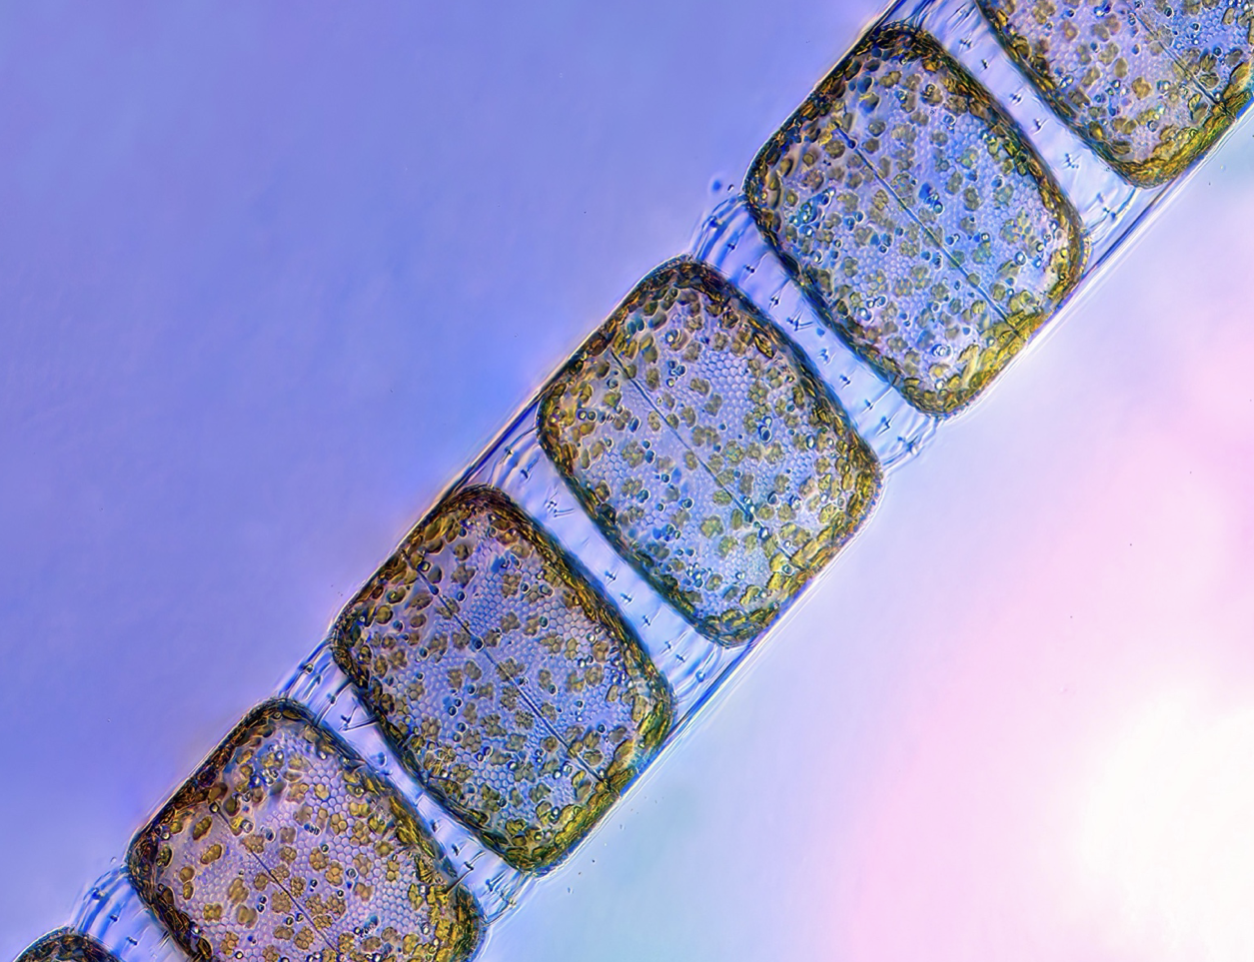
The other tropical invader is a chain forming diatom called Stephanopyxis (below). It is a real beauty with its clear glass “skeleton” scattering light like a string of gems. It is harmless to humans but still competes with the native species of diatom for light and nutrients. Stephanopyxis first appeared in the plankton hauls taken off Tiritiri Matangi Wharf in mid May. It quickly “bloomed” until it was virtually the only species of diatom present. It is now slowly decreasing in numbers as the original native species return.
It remains to be seen if it becomes part of the regular marine community.
This is just one example of how our marine (and terrestrial) environment is being impacted as climate change proceeds.
There are many other examples on Tiritiri Matangi, and the overall longer-term situation is extremely serious.
Seabird Counting
Seabird Counting
Author: Roy Gosney, Guide
Date: August 2024
Photo credit: Oscar Thomas
There is no doubting the success of Tiritiri Matangi in preserving bird species that have principally succumbed to human devastation. This achievement however provides no indication of how more successful species are faring. Enter the ubiquitous seabirds whose status is a good indicator of overall ecological health, given their existence on the margins of land and sea.
A little-known project on Tiritiri Matangi has been Seabird Counting, the aim of which is to help fill this gap in our knowledge. Seabird counting has been an annual event taking place between September and January and is in its 12th year. Mike Dye did this for the first 10 years ably describing his experience in a 17th May issue of Guidelines. I assisted Mike over the last 5 years until we were joined by Rachel Taylor. Rachel and Mike, now no longer in Auckland, left a vacuum that I, in a mad moment, agreed to fill. Consequently, I started the 23-24 season on my own, but thanks mainly to Mike’s article, a number of people have come forward and we’ve built a good team comprising: Scott Camlin, Bethny Uptegrove, Sue Beaumont Orr, Yvonne Vaneveld and Julie Benjamin.
The target species are primarily Red-billed Gulls (RBGs), Black-backed Gulls (BBGs), White-fronted Terns (WFTs) and Pied Shags (PS) because these all have established nesting areas on the Island. We are also interested in other species including Caspian Tern, Pied Shag, Little Shag, and Reef Heron. The simple method we employ involves counting these birds in known breeding areas and colonies while being vigilant for lone breeders and new colonies.
We are often asked why we bother to count seabirds. “Seagulls are everywhere, they’re a nuisance stealing our chips”. The truth is that only Black-backed Gulls are thriving, while the others are in the ‘at risk’ or ‘threatened’ conservation status. Hence, it is important to detect the population changes of these birds and to understand the causes. Tiritiri Matangi is a small piece of the moving jigsaw puzzle that is New Zealand’s overall seabird study. The study in the short term identifies areas of importance for shorebirds, estimates the abundance and proportion of the different populations that use those areas, and in the long term estimates population trends of the shorebirds.
We are a growing team; our Seabird Counting project is becoming more known amongst Supporters of Tiritiri Matangi volunteers and more people are putting their name forward to join in the counting. Is there an increasing interest in our seabird population or is it that people are seeing how much fun we’re having? (H&S skip over this…) That fun part? Bounding over hill & dale, confidently striding ahead toward precipitous cliff edges, eyes assisted by heavy binoculars, ignoring the rolly gravelly patches, feeling for the return track between thick stands of flax and twiggy bush, all while ignoring scratchy heat, aching muscles and growling hunger as we pass by seductive shady bits of lush grassy hillside; no time to rest. The birds and the ferry wait for no one.